
Barometer/Altimeter for RC
Inexpensive, airborne instrument takes the guesswork out of knowing how high an airplane really is.
John Brent Photos by Tom Chambers
WHEN THE Federal Aviation Administration, a few years ago, put out a recommended model flying altitude limit of 400 feet (where possible), it soon became obvious—and still is—that many fliers have no idea how high this is. It is of interest, therefore, to help make this altitude more "visible," if only to settle arguments. It can also be very useful to know, for sure, what the altitude looks like in terms of a given model field and typical flying there.
The altimeter described here can be very helpful for such purposes. It can also be used for attempts at RC Helicopter records. But don't look for it to help with RC Power records with conventional aircraft—that record is well over 20,000 feet! However, the RC glider altitude record is within range of this altimeter—it is calibrated to 6,000 feet and the current world record is 4,988 feet.
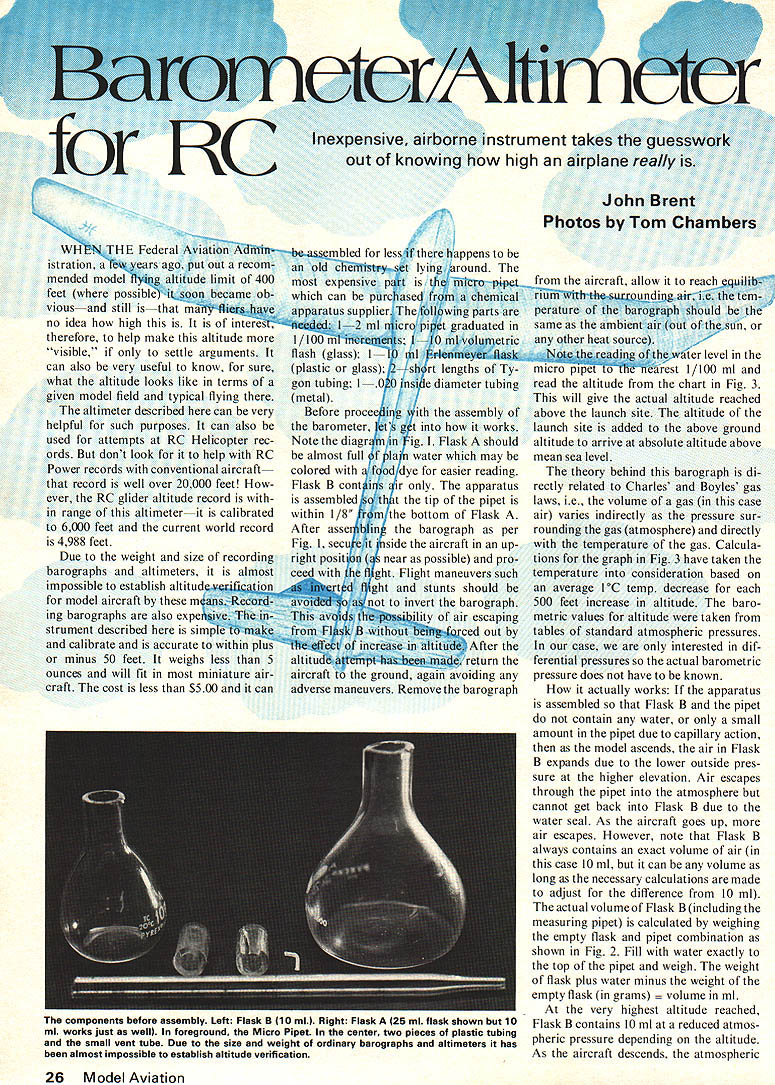
Due to the weight and size of recording barographs and altimeters, it is almost impossible to establish altitude verification for model aircraft by these means. Recording barographs are also expensive. The instrument described here is simple to make and calibrate and is accurate to within plus or minus 50 feet. It weighs less than 5 ounces and will fit in most miniature aircraft. The cost is less than $5.00 and it can be assembled for less, if there happens to be an old chemistry set lying around. The most expensive part is the micro pipet which can be purchased from a chemical apparatus supplier. The following parts are needed: 1–2 ml micro pipet graduated in 1/100 ml increments; 1–10 ml volumetric flask (glass); 1–10 ml Erlenmeyer flask (plastic or glass); 2 short lengths of Tygon tubing; 1–.020 inside diameter tubing (metal).
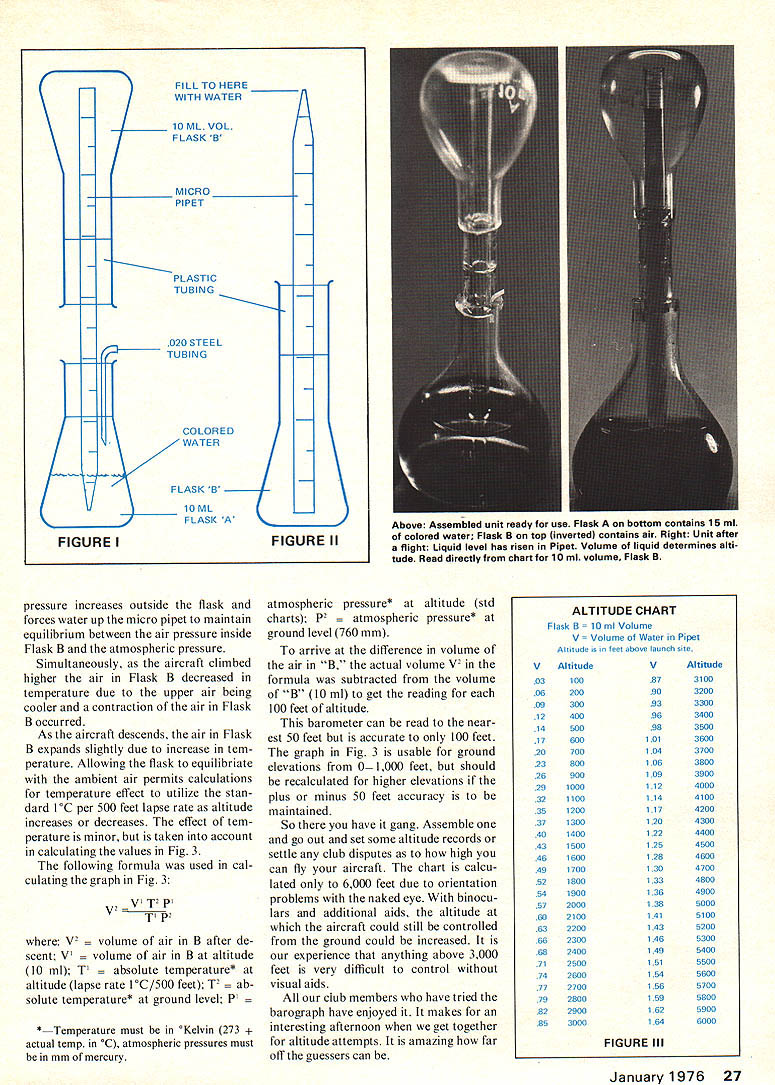
Before proceeding with the assembly of the barometer, let's get into how it works. Note the diagram in Fig. 1. Flask A should be almost full of plain water which may be colored with a food dye for easier reading. Flask B contains air only. The apparatus is assembled so that the tip of the pipet is within 1/8" from the bottom of Flask A. After assembling the barograph as per Fig. 1, secure it inside the aircraft in an upright position (as near as possible) and proceed with the flight. Flight maneuvers such as inverted flight and stunts should be avoided so as not to invert the barograph. This avoids the possibility of air escaping from Flask B without being forced out by the effect of increase in altitude. After the altitude attempt has been made, return the aircraft to the ground, again avoiding any adverse maneuvers. Remove the barograph from the aircraft, allow it to reach equilibrium with the surrounding air, i.e., the temperature of the barograph should be the same as the ambient air (out of the sun, or any other heat source). Note the reading of the water level in the micro pipet to the nearest 1/100 ml and read the altitude from the chart in Fig. 3. This will give the actual altitude reached above the launch site. The altitude of the launch site is added to the above ground altitude to arrive at absolute altitude above mean sea level.
The theory behind this barograph is directly related to Charles' and Boyle's gas laws, i.e., the volume of a gas (in this case air) varies indirectly as the pressure surrounding the gas (atmosphere) and directly with the temperature of the gas. Calculations for the graph in Fig. 3 have taken the temperature into consideration based on an average 1°C temp decrease for each 500 feet increase in altitude. The barometric values for altitude were taken from tables of standard atmospheric pressures. In our case, we are only interested in differential pressures so the actual barometric pressure does not have to be known.
How it actually works: If the apparatus is assembled so that Flask B and the pipet do not contain any water, or only a small amount in the pipet due to capillary action, then as the model ascends, the air in Flask B expands due to the lower outside pressure at the higher elevation. Air escapes through the pipet into the atmosphere but cannot get back into Flask B due to the water seal. As the aircraft goes up, air escapes. However, note that Flask B always contains an exact volume of air (in this case 10 ml, but it can be any volume as long as the necessary calculations are made to adjust for the difference from 10 ml). The actual volume of Flask B (including the measuring pipet) is calculated by weighing the empty flask and pipet combination as shown in Fig. 2. Fill with water exactly to the top of the pipet and weigh. The weight of flask plus water minus the weight of the empty flask (in grams) = volume in ml.
At the very highest altitude reached, Flask B contains 10 ml at a reduced atmospheric pressure depending on the altitude. As the aircraft descends, the atmospheric pressure increases outside Flask B, forcing water up the micro pipet to maintain equilibrium between air pressure inside Flask B and atmospheric pressure. Simultaneously as the aircraft climbs higher, air in Flask B decreased temperature pressure increases outside the flask and forces water up the micro pipet to maintain equilibrium between the air pressure inside Flask B and the atmospheric pressure.
Simultaneously, as the aircraft climbed higher the air in Flask B decreased in temperature due to the upper air being cooler and a contraction of the air in Flask B occurred.
As the aircraft descends, the air in Flask B expands slightly due to increase in temperature. Allowing the flask to equilibrate with the ambient air permits calculations for temperature effect to utilize the standard 1°C per 500 feet lapse rate as altitude increases or decreases. The effect of temperature is minor, but is taken into account in calculating the values in Fig. 3.
The following formula was used in calculating the graph in Fig. 3:
V2 = V1 T2 P1 T1 P2
where: V2 = volume of air in B after descent; V1 = volume of air in B at altitude (10 ml); T1 = absolute temperature* at altitude (lapse rate 1°C/500 feet); T2 = absolute temperature* at ground level; P1 = atmospheric pressure* at altitude (std charts); P2 = atmospheric pressure* at ground level (760 mm).
To arrive at the difference in volume of the air in "B," the actual volume V2 in the formula was subtracted from the volume of "B" (10 ml) to get the reading for each 100 feet of altitude.
This barometer can be read to the nearest 50 feet but is accurate to only 100 feet. The graph in Fig. 3 is usable for ground elevations from 0 - 1,000 feet, but should be recalculated for higher elevations if the plus or minus 50 feet accuracy is to be maintained.
So there you have it gang. Assemble one and go out and set some altitude records or settle any club disputes as to how high you can fly your aircraft. The chart is calculated only to 6,000 feet due to orientation problems with the naked eye. With binoculars and additional aids, the altitude at which the aircraft could still be controlled from the ground could be increased. It is our experience that anything above 3,000 feet is very difficult to control without visual aids.
All our club members who have tried the barograph have enjoyed it. It makes for an interesting afternoon when we get together for altitude attempts. It is amazing how far off the guessers can be.
ALTITUDE CHART
Flask B = 10 ml Volume V = Volume of Water in Pipet V = Volume in ml before launch state. V = Altitude
.03 100 .97 100 .05 200 .94 200 .07 300 .91 300 .09 400 .88 400 .12 500 .86 500 .14 600 .83 600 .17 700 .80 700 .19 800 .76 800 .23 900 .73 900 .25 1000 .70 1000 .30 1500 .62 1500 .35 2000 .56 2000 .40 2500 .50 2500 .46 3000 .44 3000 .50 3500 .39 3500 .56 4000 .34 4000 .61 4500 .30 4500 .68 5000 .26 5000 .72 5500 .23 5500 .76 6000 .20 6000 .80 6500 .18 6500 .85 7000 .16 7000 .90 7500 .14 7500 .95 8000 .13 8000 1.00 8500 .12 8500 1.05 9000 .11 9000 1.10 9500 .10 9500 1.16 10000 .09 10000 1.22 10500 .08 10500 1.28 11000 .08 11000 1.34 11500 .07 11500 1.40 12000 .07 12000 1.47 12500 .06 12500 1.54 13000 .05 13000 1.61 13500 .05 13500 1.68 14000 .04 14000 1.75 14500 .04 14500 1.83 15000 .03 15000 1.90 15500 .03 15500 2.00 16000 .03 16000
Transcribed from original scans by AI. Minor OCR errors may remain.

