
Control Line: Navy Carrier
Dick Perry
The winner of the September Mystery Plane contest was Frank Beatty, with Evan Roberts, Ed Fort, and Gary Hetrick also correctly identifying this one-of-a-kind XS2C-1 Navy variant of the Curtiss Shrike. Unlike the mystery aircraft in prior columns, the XS2C-1 apparently does not qualify for our event, having been tested only as a land-based aircraft according to Peter Bowers' book Curtiss Aircraft 1907–1947. When I submitted my column, I had two references to problems with carrier storage because of the large non-folding wing, but no actual confirmation of testing or intended use. Thanks to Frank Beatty for setting me straight.
Since writing my last column, I've been busy compiling information on Carrier scores. I reviewed record applications which I received from AMA to see what the record-setters were flying, and also examined contest results in the Navy Carrier Society's High-Low-Landing newsletter ($6 to LeRoy Cordes, 1412 West Hood, Chicago, IL 60660 for annual membership) to establish a database for performance across the country.
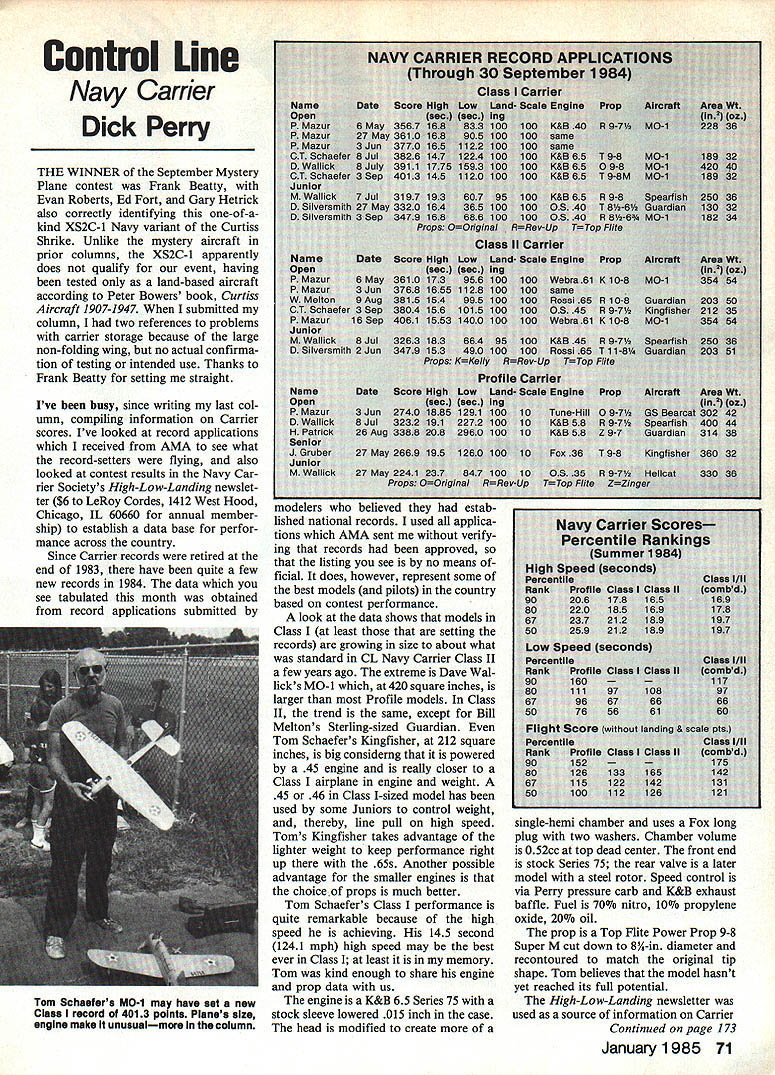
Since Carrier records were retired at the end of 1983, there have been quite a few new records in 1984. The data tabulated this month were obtained from record applications submitted by modelers who believed they had established national records. I used all applications which AMA sent me without verifying that records had been approved, so the listing you see is by no means official. It does, however, represent some of the best models (and pilots) in the country based on contest performance.
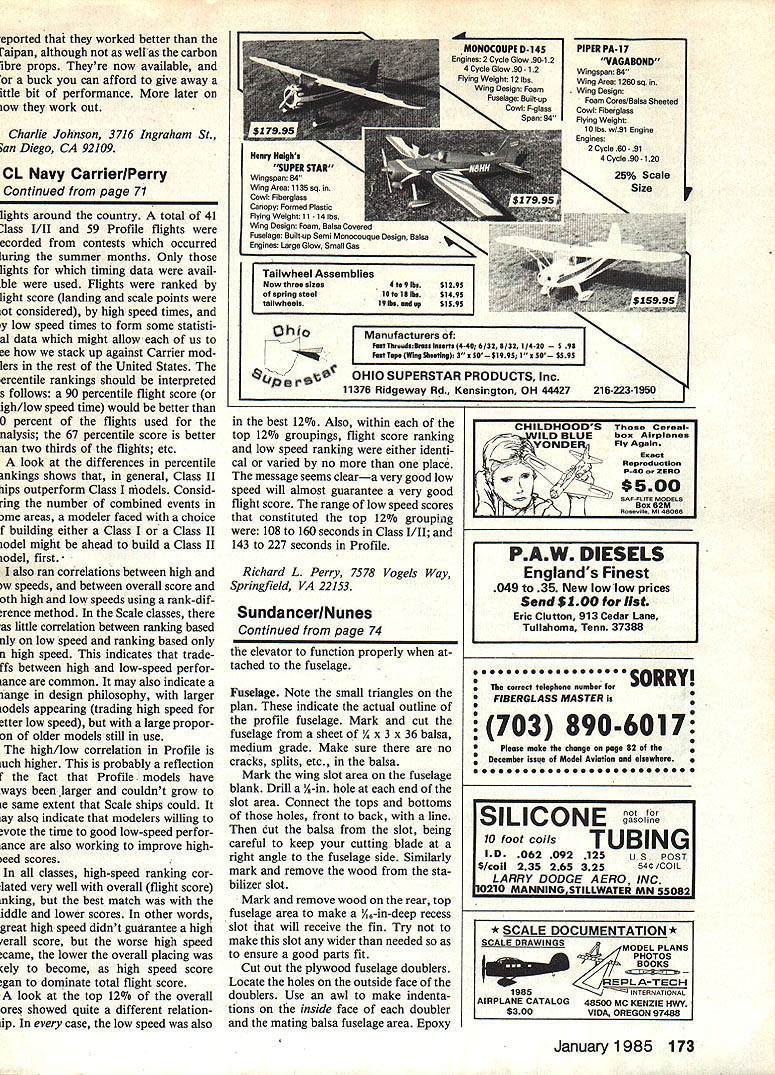
A look at the data shows that models in Class I (at least those that are setting the records) are growing in size to about what was standard in CL Navy Carrier Class II a few years ago. The extreme is Dave Wallick's MO-1 which, at 420 square inches, is larger than most Profile models. In Class II, the trend is the same, except for Bill Melton's Sterling-sized Guardian. Even Tom Schaefer's Kingfisher, at 212 square inches, is large considering that it is powered by a .45 engine and is really closer to a Class I airplane in engine size and weight. A .45 or .46 in a Class I-sized model has been used by some Juniors to control weight, and thereby line pull on high speed. Tom's Kingfisher takes advantage of the lighter weight to keep performance right up there with the .65s. Another possible advantage for the smaller engines is that the choice of props is much better.
Tom Schaefer's Class I performance is quite remarkable because of the high speed he is achieving. His 14.5 second (124.1 mph) high speed may be the best ever in Class I; at least it is in my memory. Tom was kind enough to share his engine and prop data.
Tom Schaefer — engine and prop details
- Engine: K&B 6.5 Series 75 with a stock sleeve lowered .015 inch in the case.
- Head: Modified to create more of a single-hemi chamber; uses a Fox long plug with two washers.
- Chamber volume: 0.52 cc at top dead center.
- Front end: Stock Series 75.
- Rear valve: Later model with a steel rotor.
- Speed control: Perry pressure carburetor and K&B exhaust baffle.
- Fuel: 70% nitro, 10% propylene oxide, 20% oil.
- Prop: Top Flite Power Prop 9-8 Super M cut down to 8-1/8 inch diameter and recontoured to match the original tip shape.
Tom believes the model hasn't yet reached its full potential.
The High-Low-Landing newsletter was used as a primary source of information on Carrier events.
CL Navy Carrier/Perry
Flights around the country: a total of 41 Class I/II and 59 Profile flights were recorded from contests which occurred during the summer months. Only those flights for which timing data were available were used. Flights were ranked by light score (landing and scale points were not considered), by high speed times, and by low speed times to form some statistical data which might allow each of us to see how we stack up against Carrier modelers in the rest of the United States.
The percentile rankings should be interpreted as follows: a 90th percentile flight score (or high/low speed time) would be better than 90 percent of the flights used for the analysis; the 67th percentile score is better than two thirds of the flights; etc.
Data and method
- Included flights: only contests with available timing data.
- Rankings based on: light score (excluding landing and scale), high speed, and low speed.
- Correlation method: rank-difference correlations between high and low speeds, and between overall score and both high and low speeds.
Findings
- In general, Class II ships outperform Class I models. Considering the number of combined events in some areas, a modeler faced with a choice of building either a Class I or a Class II model might be ahead to build a Class II model first.
- In the Scale classes, there was little correlation between ranking based only on low speed and ranking based only on high speed. This indicates tradeoffs between high- and low-speed performance are common. It may also indicate a shift in design philosophy, with larger models appearing (trading high speed for better low speed) while a large proportion of older models remain in use.
- The high/low correlation in Profile is much higher. This is probably because Profile models have traditionally been larger and couldn't grow to the same extent as Scale ships. It may also indicate that modelers willing to devote time to good low-speed performance are also working to improve high-speed scores.
- In all classes, high-speed ranking correlated very well with overall (flight) score; but the best match was with the middle and lower scores. In other words, great high speed didn't guarantee a high overall score, but poor high speed made a low overall placing likely, as high speed score began to dominate total flight score.
- A look at the top 12% of the overall scores showed a different relationship: in every case, the low speed was also in the best 12%. Within each of the top 12% groupings, flight score ranking and low speed ranking were either identical or varied by no more than one place. The message seems clear — a very good low speed will almost guarantee a very good flight score.
Range of low-speed scores constituting the top 12% grouping:
- Class I/II: 108 to 160 seconds.
- Profile: 143 to 227 seconds.
Richard L. Perry 7578 Vogels Way, Springfield, VA 22153.
Transcribed from original scans by AI. Minor OCR errors may remain.

