
Don't let the title throw you. It's an easy-to-read article with useful charts which yield valuable data for comparing designs, or selecting models to build, in related terms of area, weight, wing/power loading.
Jack Burns
Empirical RC Model Performance Criteria
WHEN YOU select a new plane and engine, what criteria do you use? It depends on your ability to fly, of course. It also depends on the performance you expect from a plane and engine. If you are an experienced modeler, of course, you make the choice based on the experience and your judgment. However, the relatively inexperienced probably could use some help. Hopefully, this discussion and the charts will help you make the proper choices.
What is performance? Well, it can be defined by many formulae, but they are too abstract for most modelers. Performance can be as abstract as the beautiful sight of a glider just hanging up there, maybe gracefully following a local hawk. Performance certainly is a Formula I racer turning a 1:15 qualifying heat in a championship contest; no one will deny that an average speed of 120 mph is performance! Performance can be the moment a beginner suddenly gets it all together and can take off, fly around the field and make a safe landing. Thus, performance can be very technical, or it can be the subjective judgments you form at the field watching many different planes fly.
What airplane criteria determine performance? Several, but let's confine the discussion to three: weight, wing area and engine power as designated by displacement. A little arithmetic: weight divided by area is wing loading (W/S) and is perhaps the most important item. Weight divided by power is power loading (W/D). You all know power is what makes the beast go. A low W/S means a light plane or large wing area for the weight and a high W/S is a heavy plane or small wing. Low W/D means lots of power and high W/D is low power. Let's examine the manner in which these ratios determine performance.
In full-size airplane calculations, pounds, square feet and horsepower are used. For model use, to keep the numbers whole, it is more convenient to express W/S in ounces per square foot and W/D in pounds per cubic inch displacement. (This assumes horsepower is proportional to displacement which is only roughly correct.) Thus, the charts are marked in those units.
Engine displacement is used instead of horsepower since actual HP is not readily available. Besides, you never run engines full out; maximum potential is developed on the test bench after a careful break-in sequence. Well, maybe pylon racer guys and sport fliers would rather have the engine last longer and sacrifice a bit of performance. In calculating max speed lines I used 167 HP per cu. in., average engines tested by Mr. Peter Chinn using 5% nitro fuel and mufflers. This assumes horsepower proportional to displacement, roughly correct. Hotter engines, high nitro fuel, no mufflers and a free‑wheeling prop will allow the engine to wind out to full rpm and will give lower W/D and higher speeds than shown on the charts. Thus racing .40s have much higher output and on average much lower W/D. Cox TDs also put out more than average.
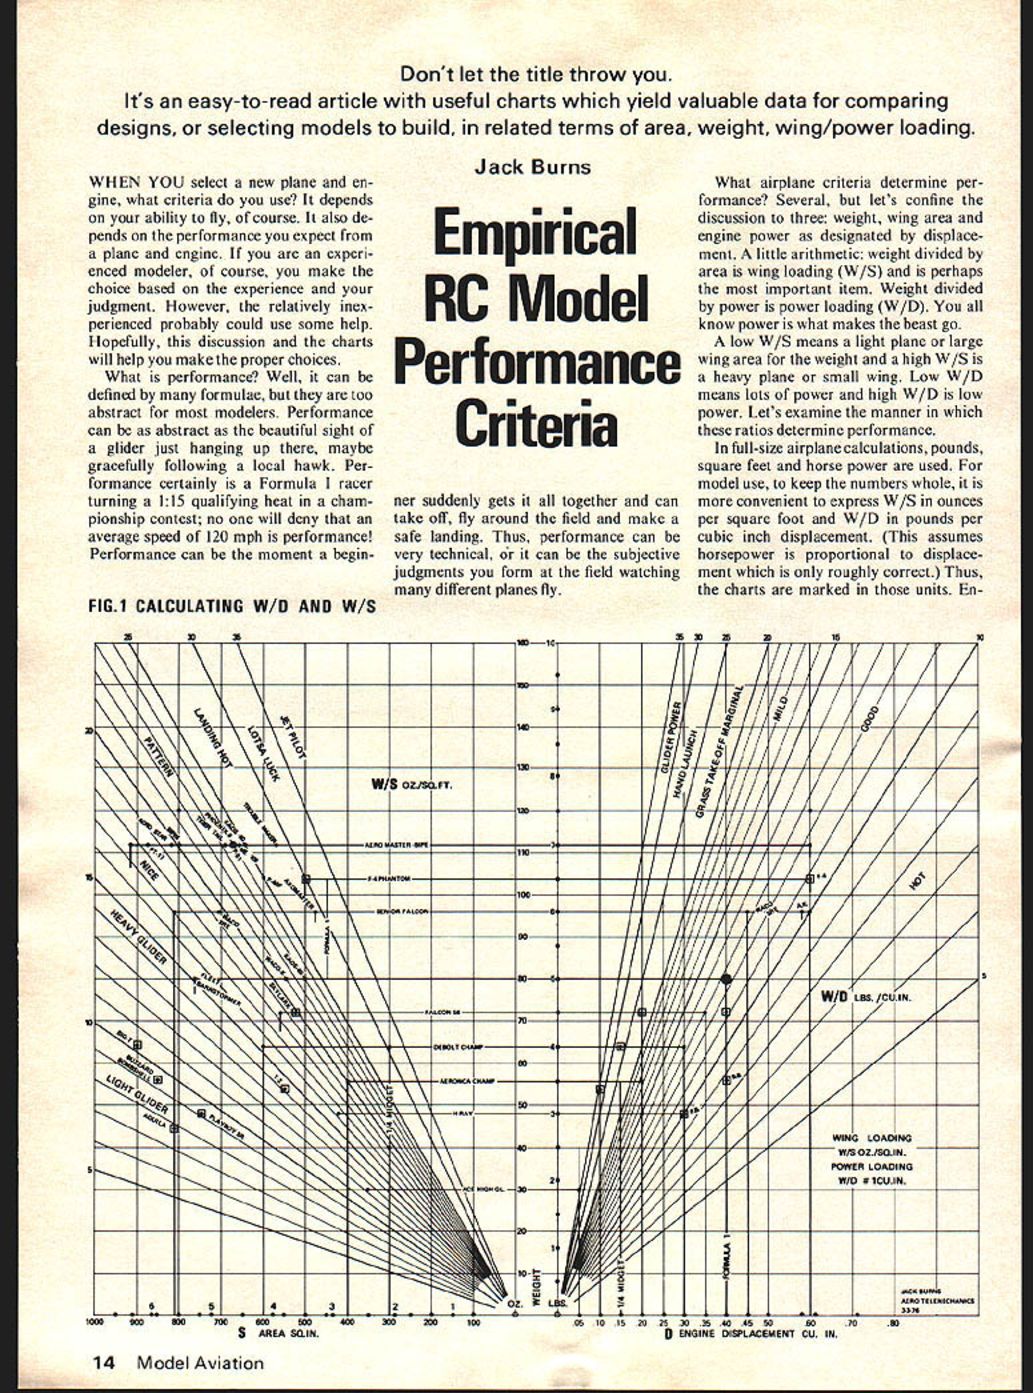
FIG. 1 CALCULATING W/D AND W/S
Fig. 1 helps find W/S and W/D without a calculator. W/S and W/D radial lines are plotted against weight, area and engine size. To find W/S locate the point where the weight line intersects the area line. Similarly, reading the right weight scale and engine displacement yields a direct reading of W/D.
Example: Senior Falcon shows Point A — 810 sq. in., 6 lb equals 17 W/S oz./sq. ft. Point B — 6 lb meets .45 displacement line W/D = 13.3. A good all‑around plane has characteristics in this area and is a very nice sport flier and also a good beginner. Although Point C W/D sometimes is not satisfactory for big‑bird flying, particularly off grass fields. Senior Falcons powered with .60s give the fliers more kick to toss the plane around the sky a bit; of course the wing center section has to be reinforced.
Another use of the chart is to give a rough estimate of glider performance. The W/S lines 8–14 are labeled Light—Heavy glider. A light glider will have low sink rate and will really go up in thermals. A heavy glider will fly faster, penetrate head winds better and have a higher sink rate. Use engine launch, climb and then drop. Read the W/D line near the line marked "Glider Power" to select the engine. Overpower a glider — those long thin wings just like high speed. I believe I have used .049, .10 and .15 engines on progressively larger gliders. Big Tat, 900 sq. in., W/S 10–15 is a very nice performer. Notice the adjective ratings on the charts — degrees per... Notice the adjective ratings on the charts—degrees of performance. These are my impressions after many years of flying and observing model planes.
Application of Empirical Data:
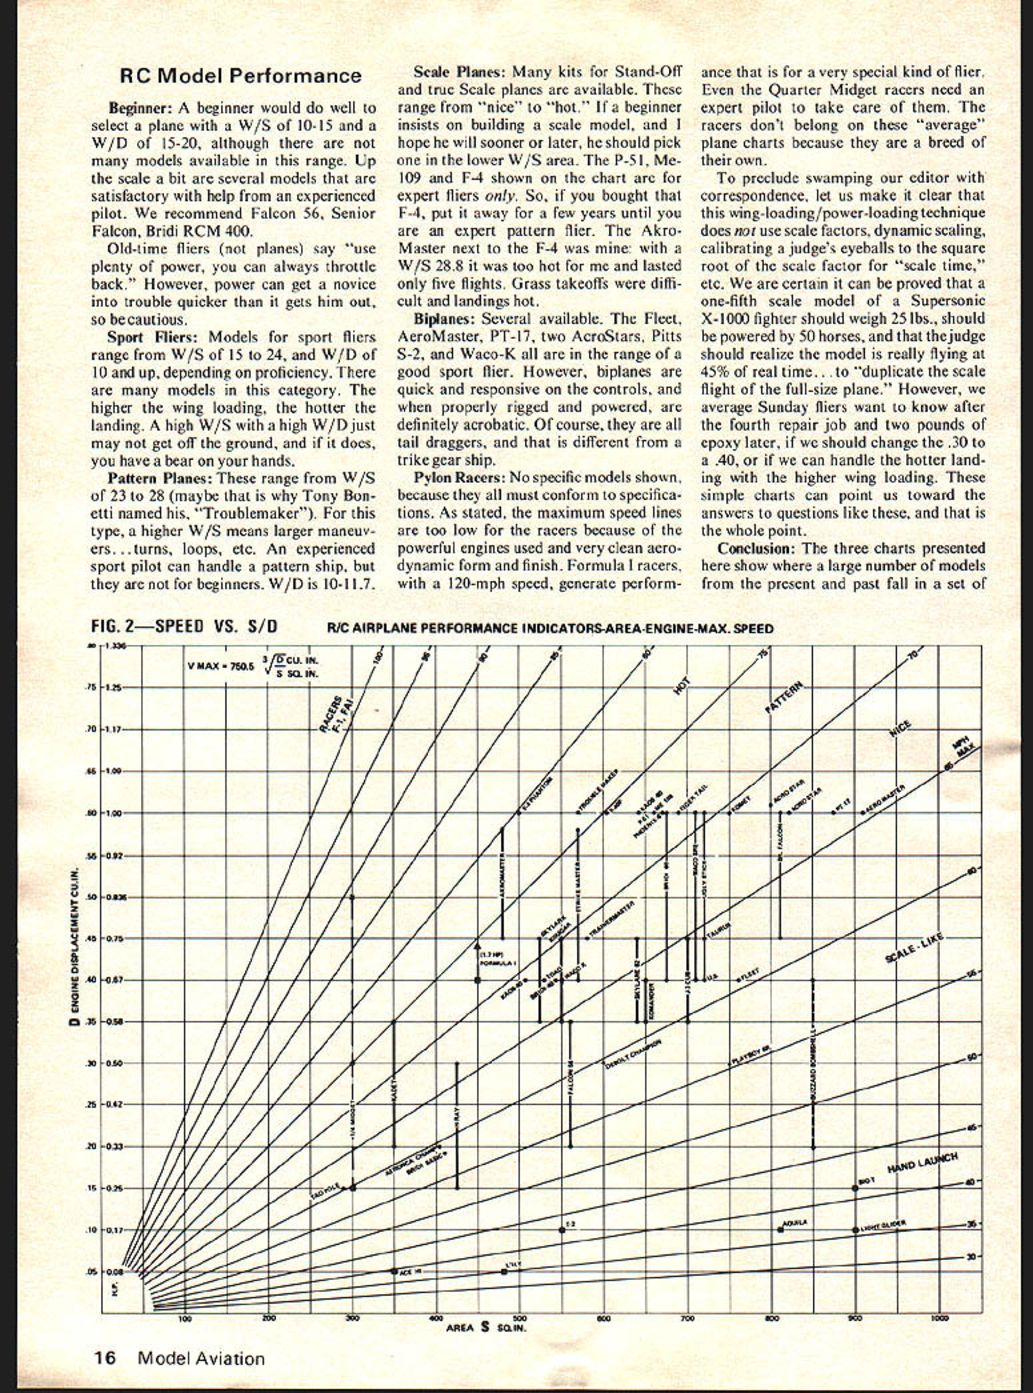
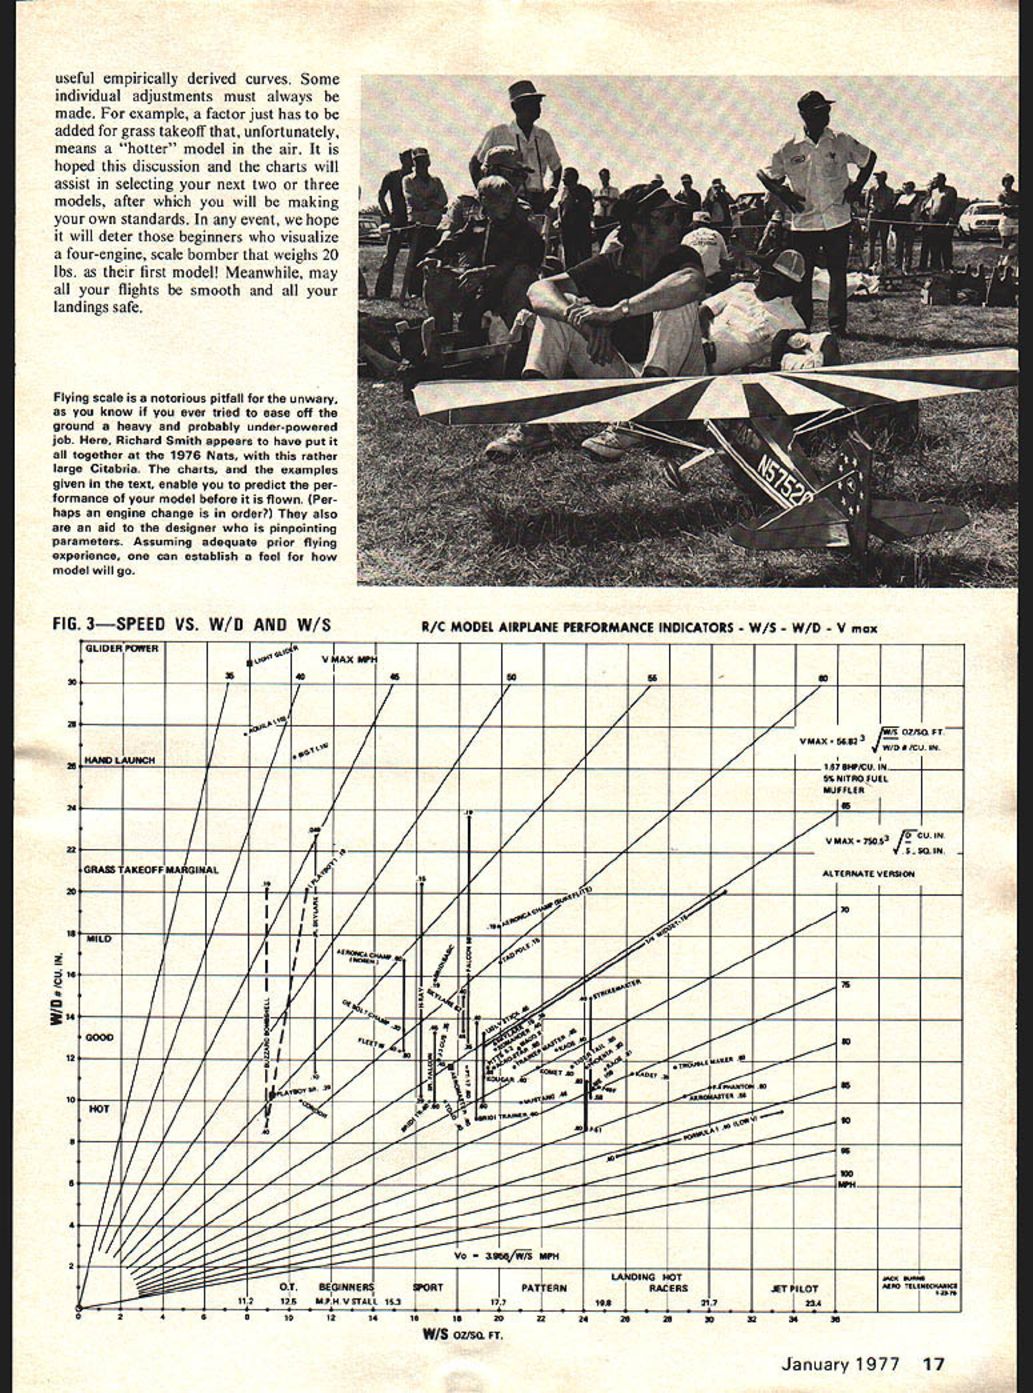
Now we get down to specific model planes. There are many planes plotted on Fig. 2 and 3 according to wing and power loading. Thus, we can compare planes with our ideas of performance. The maximum speed lines that radiate across Fig. 2 and 3 help relate wing loading, speed and performance, and thus separate the kites from the bombs. The speed lines do not say faster is better, or vice versa, but do give an indication of relative performance as a guide to engine selection.
RC Old-Timers:
Buzzard Bombshell, 850 sq. in., 3 1/2 lb., .40 eng., W/S 9, W/D 8.75. At the low end of the wing loading scale, my B.B. has a predictably fantastic glide, but oh, that power! Hot is not the word... more like destructive. All that power caused stresses that failed the wing on the 23rd flight. When rebuilt, it will have a .19 (or an old .29), and the wing will be reinforced. Playboy Senior, next to the B.B. on the chart, also experienced wing failure according to the author of the magazine article. Again, apparently too much power for a low W/S. Please use a smaller engine in these O.T. birds or be certain to reinforce the wing center section. The light structure that goes along with a light wing loading is not strong enough to handle high power. With radio control, we can put G-loads on a plane it might not encounter as a free flight.
RC Model Performance
Beginner: A beginner would do well to select a plane with a W/S of 10-15 and a W/D of 15-20, although there are not many models available in this range. Up the scale a bit are several models that are satisfactory with help from an experienced pilot. We recommend Falcon 56, Senior Falcon, Bridi RCM 400.
Old-time fliers (not planes) say "use plenty of power, you can always throttle back." However, power can get a novice into trouble quicker than it gets him out, so be cautious.
Sport Fliers: Models for sport fliers range from W/S of 15 to 24, and W/D of 10 and up, depending on proficiency. There are many models in this category. The higher the wing loading, the hotter the landing. A high W/S with a high W/D just may not get off the ground, and if it does, you have a bear on your hands.
Pattern Planes: These range from W/S of 23 to 28 (maybe that is why Tony Bonetti named his, "Troublemaker"). For this type, a higher W/S means larger maneuvers... turns, loops, etc. An experienced sport pilot can handle a pattern ship, but they are not for beginners. W/D is 10-11.7.
Scale Planes: Many kits for Stand-Off and true Scale planes are available. These range from "nice" to "hot." If a beginner insists on building a scale model, and I hope he will sooner or later, he should pick one in the lower W/S area. The P-51, Me-109 and F-4 shown on the chart are for expert fliers only. So, if you bought the F-4, put it away for a few years until you are an expert pattern flier. The AkroMaster next to the F-4 was mine; with a W/S 28.8 it was too hot for me and lasted only five flights. Grass takeoffs were difficult and landings hot.
Biplanes: Several available. The Fleet, AeroMaster, PT-17, two AeroStars, Pitts S-2, and Waco-IK all are in the range of a good sport flier. However, biplanes are quick and responsive on the controls, and when properly rigged and powered, are definitely acrobatic. Of course, they are all tail draggers, and that is different from a trike gear ship.
Pylon Racers: No specific models shown, because they all must conform to specifications. As stated, the maximum speed lines are too low for the racers because of the powerful engines used and very clean aerodynamic form and finish. Formula I racers, with a 120-mph speed, generate performance that is for a very special kind of flier. Even the Quarter Midget racers need an expert pilot to take care of them. The racers don't belong on these "average" plane charts because they are a breed of their own.
To preclude swamping our editor with correspondence, let us make it clear that this wing-loading/power-loading technique does not use scale factors, dynamic scaling, calibrating a judge's eyeballs to the square root of the scale factor for "scale time," etc. We are certain it can be proved that a one-fifth scale model of a Supersonic X-1000 fighter should weigh 25 lbs., should be powered by 50 horses, and that the judge should realize the model is really flying at 45% of real time... to "duplicate the scale flight of the full-size plane." However, we average Sunday fliers want to know after the fourth repair job and two pounds of epoxy later, if we should change the .30 to a .40, or if we can handle the hotter landing with the higher wing loading. These simple charts can point us toward the answers to questions like these, and that is the whole point.
Conclusion: The three charts presented here show where a large number of models from the present and past fall in a set of useful empirically derived curves. Some individual adjustments must always be made. For example, a factor just has to be added for grass takeoff that, unfortunately, means a "hotter" model in the air. It is hoped this discussion and the charts will assist in selecting your next two or three models, after which you will be making your own standards. In any event, we hope it will deter those beginners who visualize a four-engine, scale bomber that weighs 20 lbs. as their first model! Meanwhile, may all your flights be smooth and all your landings safe.
Transcribed from original scans by AI. Minor OCR errors may remain.

