
Flying Field Layout to Meet Noise Criteria
If you have a really huge flying field, your engine-powered models can generate lots of noise and not be a nuisance to neighbors. On the other hand, reducing the sound by a few decibels can let you operate from an area with much less separation from others, as described in this article. — G. F. Abbott
The noise issue
The noise issue is attracting an increasing amount of concern among modelers these days. The major reason we are concerned with noise is that our neighbors object. If they object enough, we lose flying fields. Of course, if there are no neighbors near our fields, there will be no problem. The question, then, is: how near is too near?
There has been a great deal of study over the years on environmental noise. One issue is health hazards from exposure to high levels (a personal risk to modelers — prolonged exposure can reduce hearing). The issue that threatens our flying fields, however, is public reaction to noise.
Annoyance due to noise is subjective. Modelers will tolerate far more model airplane noise than someone trying to take a nap on a Sunday afternoon. There are standards and studies of public reaction to noise; the International Organization for Standardization (ISO) provides a useful basis for this discussion.
Standard procedure (ISO-based)
The referenced standard follows this procedure:
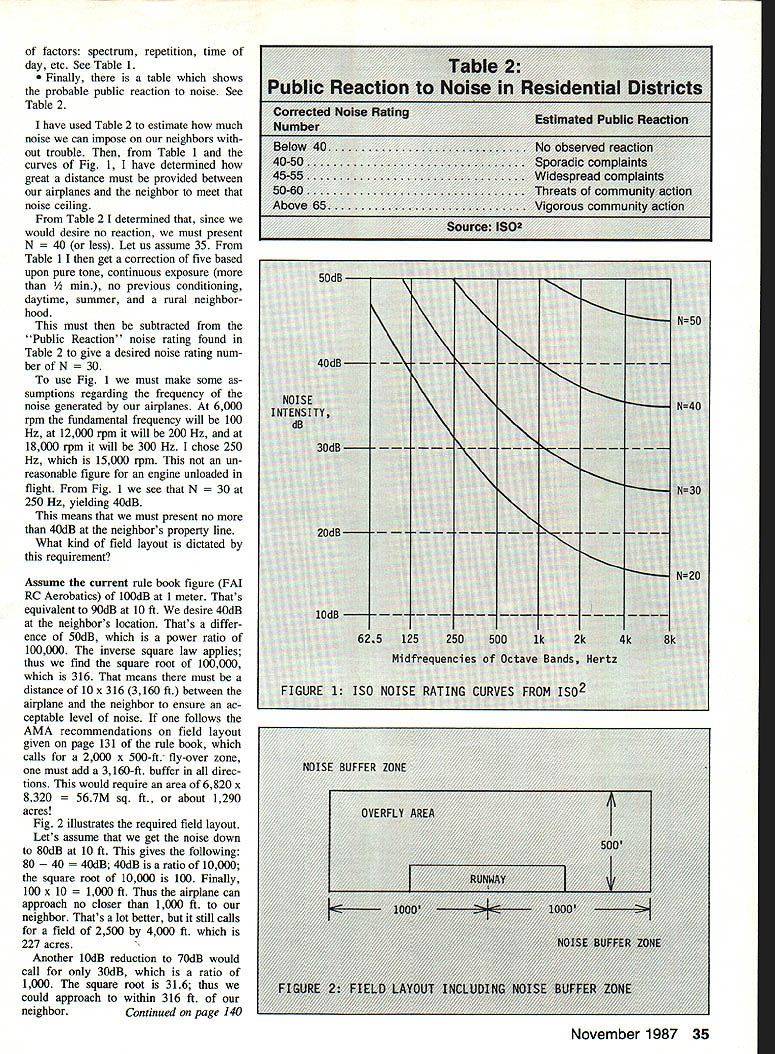
- A set of curves relate noise intensity and frequency and provide a Noise Rating number "N" (see Figure 1).
- A correction is applied to the uncorrected N number to account for influencing factors (see Table 1).
- Table 2 shows the probable public reaction to a given corrected N.
Using Table 2, one can estimate how much noise may be imposed on neighbors without trouble. The curves in Figure 1 determine what sound level must be present at the neighbor's property line to meet the noise ceiling determined from Table 2.
Determining acceptable noise levels
- From Table 2, to have no observed reaction we must present a corrected N at or below about 40. (To be conservative in examples below, a corrective sequence leading to 40 dB at the neighbor is used.)
- Table 1 gives corrections based on noise character, peak factor, repetitiveness, prior conditioning, time of day/season, and neighborhood type. In a representative residential case (pure tone, continuous exposure, no previous conditioning, daytime, summer, rural neighborhood) the summed correction can be about +5 (see Table 1).
- To use the ISO curves (Figure 1) we need an approximate frequency for model airplane noise. Typical fundamentals:
- 6,000 rpm → 100 Hz
- 12,000 rpm → 200 Hz
- 18,000 rpm → 300 Hz
- An unloaded engine in flight around 15,000 rpm suggests ~250 Hz, a reasonable choice for the example.
- From the ISO curves at 250 Hz, the Noise Rating corresponding to a non-annoying public reaction leads to a target of about 40 dB at the neighbor’s property line.
Thus, a practical design target in examples below is: no more than 40 dB at the neighbor's property line.
Field layout calculations (inverse square law)
Assumptions and conversions used:
- Rule book figure for FAI/RC Aerobatics: 100 dB at 1 meter.
- 100 dB at 1 m ≈ 90 dB at 10 ft (approximate conversion used in the original analysis).
- Desired level at neighbor: 40 dB.
- The inverse square law for sound in free field: a 20 dB change corresponds to a tenfold change in distance (or power ratio math described below).
Calculations:
- Base case — 90 dB at 10 ft to 40 dB at neighbor
- Difference: 90 − 40 = 50 dB.
- Power ratio for 50 dB = 10^(50/10) = 100,000.
- Distance ratio (since level falls off with distance squared): square root of 100,000 ≈ 316.
- Required distance = 10 ft × 316 ≈ 3,160 ft.
- If AMA recommended fly-over zone is 2,000 × 500 ft, adding a 3,160-ft buffer in all directions requires an area about 6,820 × 8,320 ft ≈ 56.7 million sq ft ≈ 1,290 acres.
- Improved source — 80 dB at 10 ft to 40 dB at neighbor
- Difference: 80 − 40 = 40 dB.
- Power ratio for 40 dB = 10^(40/10) = 10,000.
- Distance ratio = sqrt(10,000) = 100.
- Required distance = 10 ft × 100 = 1,000 ft.
- That allows a field of roughly 2,500–4,000 ft dimensions; area ≈ 227 acres.
- Further improvement — 70 dB at 10 ft to 40 dB at neighbor
- Difference: 70 − 40 = 30 dB.
- Power ratio for 30 dB = 10^(30/10) = 1,000.
- Distance ratio = sqrt(1,000) ≈ 31.6.
- Required distance ≈ 10 ft × 31.6 ≈ 316 ft.
These examples show how reductions of 10 dB at the source can dramatically reduce required buffer distances and land area.
Conclusions
- Noise from engine-powered models has a profound effect on real estate requirements for flying fields.
- Improvements that lower sound levels at a fixed reference (e.g., 10 ft) produce disproportionately large reductions in the required buffer distance to neighbors.
- Achieving 80 dB at 10 ft may be plausible; achieving 70 dB is unlikely but would greatly reduce land needs.
- This is an important problem deserving attention from the modelers' community and organizations such as the AMA.
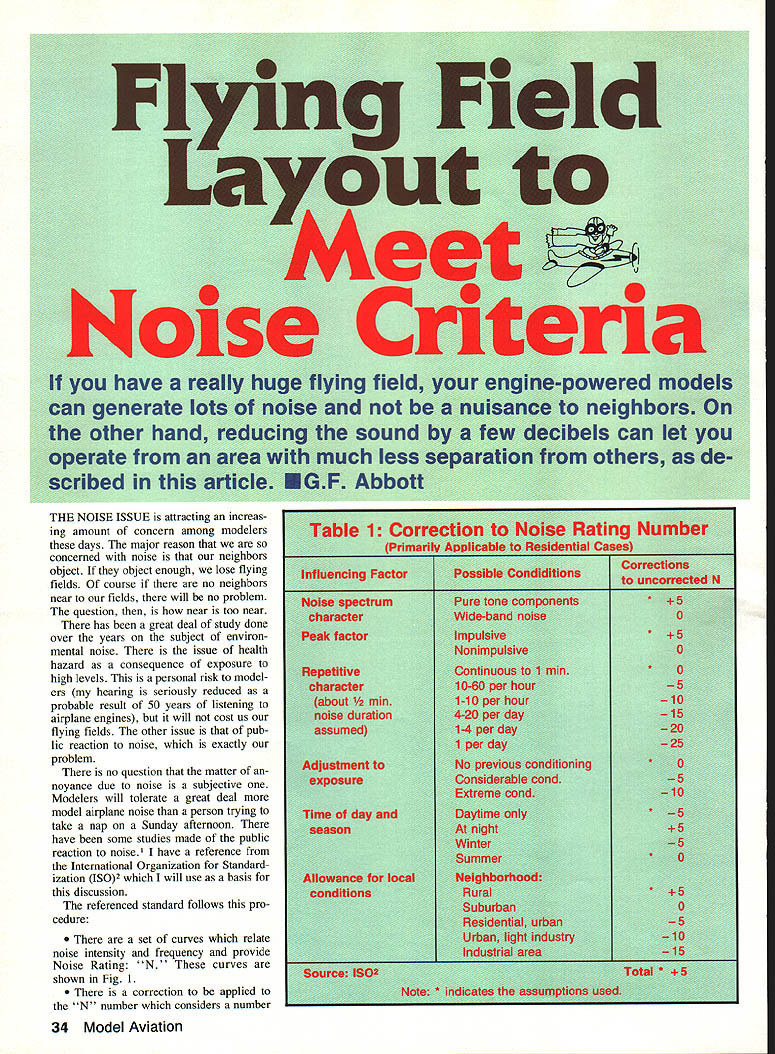
Table 1: Correction to Noise Rating Number
(Primarily applicable to residential cases)
- Noise spectrum character:
- Pure tone components: +5
- Wide-band noise: 0
- Peak factor:
- Impulsive: +5
- Nonimpulsive: 0
- Repetitive character (about ½ min. noise duration assumed):
- Continuous to 1 min.: 0
- 10–60 per hour: −5
- 1–10 per hour: −10
- 4–20 per day: −15
- 1–4 per day: −20
- 1 per day: −25
- Adjustment to exposure (previous conditioning):
- No previous conditioning: 0
- Considerable conditioning: −5
- Extreme conditioning: −10
- Time of day and season:
- Daytime only: 0
- At night: −5
- Winter: −5
- Summer: 0
- Allowance for local conditions (neighborhood):
- Rural: +5
- Suburban: 0
- Residential, urban: −5
- Urban, light industry: −10
- Industrial area: −15
Source: ISO Total (example case shown): +5 Note: The example total assumes pure tone, continuous exposure (>½ min.), no previous conditioning, daytime, summer, and a rural neighborhood.
Table 2: Public Reaction to Noise in Residential Districts
- Below 40: No observed reaction
- 40–50: Sporadic complaints
- 45–55: Widespread complaints
- 50–60: Threats of community action
- Above 65: Vigorous community action
Source: ISO
Figures
- Figure 1: ISO noise rating curves (noise rating number N versus frequency and sound pressure level).
- Figure 2: Field layout including noise buffer zone (illustrates fly-over zone plus radial buffer to neighbor boundaries).
References
- Ernest J. McCormick, Human Factors Engineering, 3rd ed., McGraw-Hill, New York, 1970, pp. 525–528.
- Rating noise with respect to hearing conservation, speech communication, and annoyance, ISO, Technical Committee 43, Acoustics, Secretariat-189, August 1961.
Transcribed from original scans by AI. Minor OCR errors may remain.

