
Model Propeller Noise
The first article of this series on model propeller noise reviewed basic theoretical concepts concerning thrust, drag, and aircraft performance, then continued with definitions of sound, frequency, sound pressure level (SPL), and sound power level. The nonlinear manner in which sound levels combine—a result of the logarithmic nature of the dB scale—was explained to help the reader understand the relative contributions of various noise sources to total sound. Data presented showed that, in a typical model aircraft equipped with a reasonably efficient muffler, the propeller rather than the engine dominates the noise signature.
Because of the specific additive behavior of sound components, reducing the dominant noise source—the propeller—is the critical task in model airplane noise abatement. Propeller noise consists of several components (noise due to thrust, torque, thickness effects, and others). Reducing a lesser engine noise or a lesser propeller noise component may bring no perceptible diminution in total noise. For example, eliminating 80 dB of thrust acoustical power from a 90.4 dB total acoustical power only slightly reduces the sound level to about 90 dB. The major challenge, then, is to identify the leading contributor to model propeller noise.
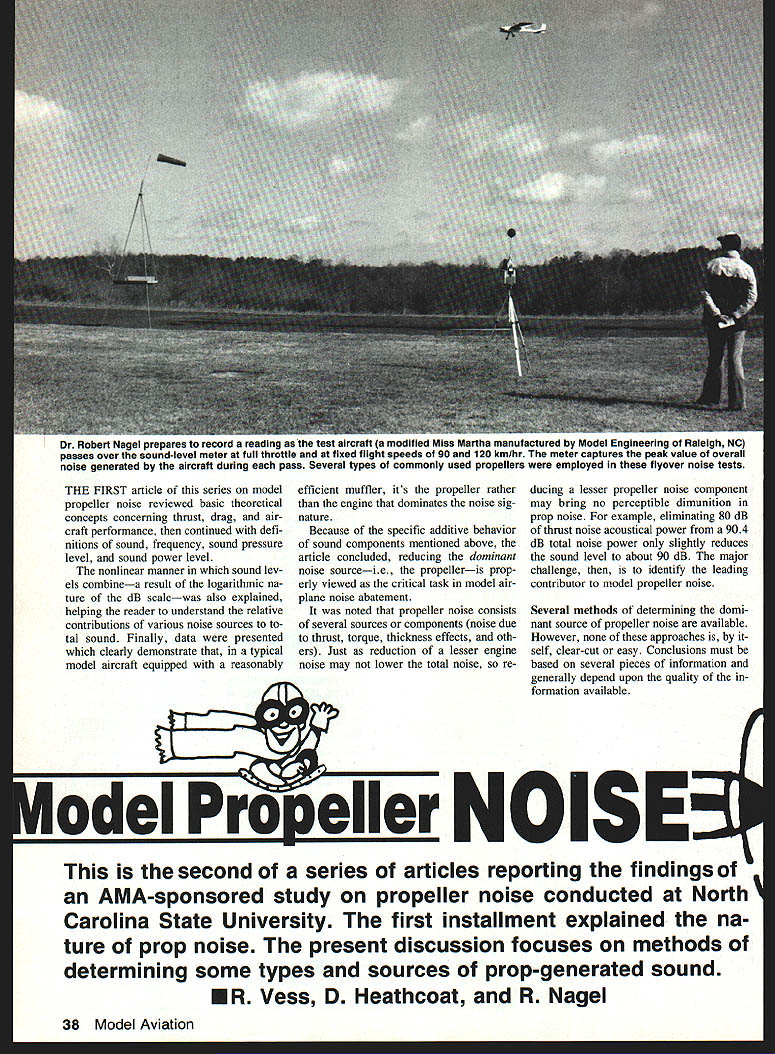
This is the second of a series of articles reporting the findings of an AMA-sponsored study on propeller noise conducted at North Carolina State University. The first installment explained the nature of prop noise. The present discussion focuses on methods of determining some types and sources of prop-generated sound.
R. Vess, D. Heathcoat, and R. Nagel
Several theories published in the scientific literature demonstrate that various types of propeller noise are related to measurable quantities such as thrust and propeller tip speed. If the propeller noise as measured exhibits variances consistent with the theoretical pattern for a particular type of noise—e.g., thrust or torque—one can identify it with reasonable confidence as primarily that type of noise. For example, if measurements show that the prop noise changes with rpm, thrust, or flight velocity in a fashion consistent with torque noise theory, one can suppose torque to be a major cause of the overall prop noise.
Each propeller noise source—thrust, torque, thickness effects, etc.—exhibits a characteristic directivity pattern. The noise caused by torque loading, for example, will be strongest at 90 degrees to the side (in the plane of the propeller) at a specific distance from the propeller, while thrust-caused noise will be of little magnitude at that same location. Thus, careful measurement of directivity patterns can provide information about the source of the sound.
Differentiating among multiple noise components to single out the leading mechanism is difficult. One way to circumvent this is to operate different propellers while holding thrust or torque constant, thereby eliminating thrust or torque loading as causes of variation in the total noise pattern. Observed changes in prop noise may also be provisionally related to physical differences among propellers—in pitch, diameter, planform, etc.—since such variations can alter the dominant noise mechanism.
Experimental Setup
Two types of experimental data were used in this study:
- Carefully controlled laboratory tests in an anechoic wind tunnel. Props were powered by Astro Flight electric motors.
- Field tests in which an experimental model aircraft was instrumented and flown over a microphone.
#### Anechoic wind tunnel
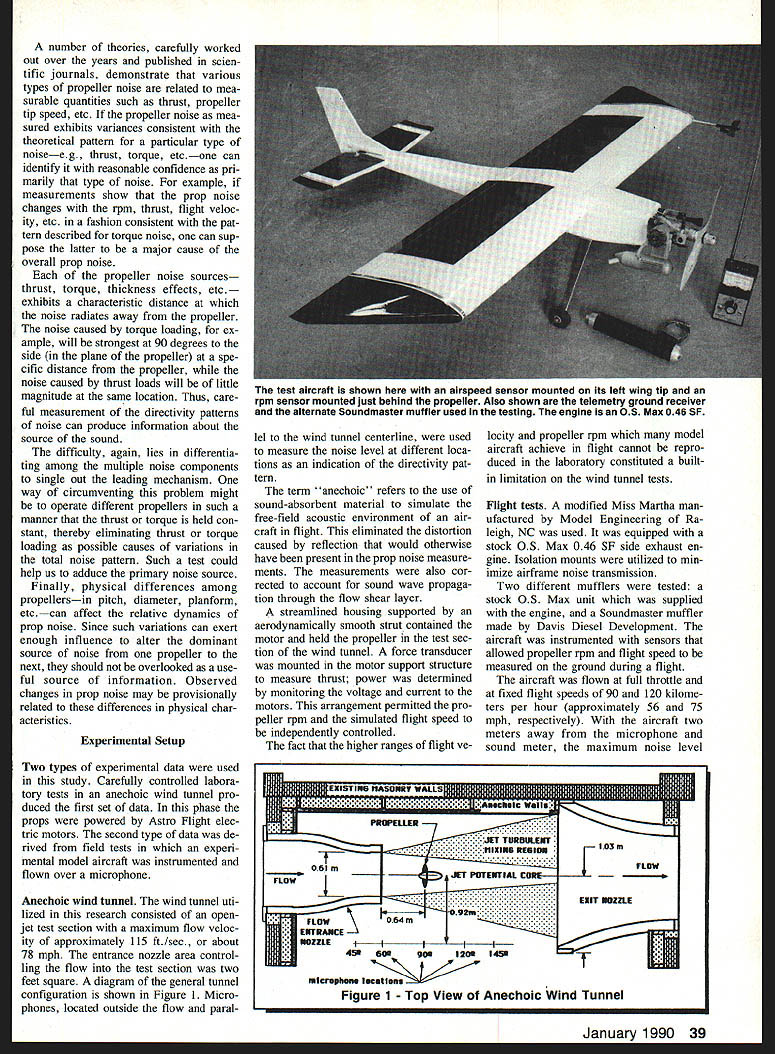
The wind tunnel used an open-jet test section with a maximum flow velocity of approximately 115 ft/s (about 78 mph). The entrance nozzle area controlling the flow into the test section was two feet square. Microphones, located outside the flow and parallel to the wind tunnel centerline, measured noise levels at different locations to indicate directivity patterns.
"Anechoic" refers to the use of sound-absorbent material to simulate the free-field acoustic environment of an aircraft in flight. This eliminated distortion caused by reflections that would otherwise be present in prop noise measurements. Measurements were corrected to account for sound wave propagation through the flow shear layer.
A streamlined housing supported by an aerodynamically smooth strut contained the motor and held the propeller in the test section. A force transducer mounted in the motor support structure measured thrust; power was determined by monitoring the voltage and current to the motors. This arrangement permitted independent control of propeller rpm and simulated flight speed.
A limitation of the tunnel tests was that the higher ranges of flight velocity and propeller rpm reached by many model aircraft in flight could not be reproduced in the laboratory.
#### Flight tests
A modified Miss Martha manufactured by Model Engineering of Raleigh, NC, was used. It was equipped with a stock O.S. Max 0.46 SF exhaust silencer. Isolation mounts were utilized to minimize airframe noise transmission.
Two mufflers were tested:
- The stock O.S. Max unit supplied with the engine.
- A Soundmaster muffler made by Davis Diesel Development.
The aircraft was instrumented with sensors to record prop rpm and flight speed. It was flown at full throttle and at fixed flight speeds of 90 and 120 km/h (approximately 56 and 75 mph, respectively). With the aircraft two meters from the microphone and sound meter, the maximum overall sound pressure level (OASPL) was recorded for each flyover. The flight data were used to verify and extrapolate laboratory findings.
Data Base
Several representative propellers typical of those used by model aircraft pilots were selected for testing. In the flight tests, propellers were chosen to require the torque provided by the O.S. Max 0.46 SF engine. Inclusion of a propeller in this study does not imply endorsement; results must be carefully extended beyond the range of the data base.
Acoustic data were measured in the wind tunnel at microphone angles of 45°, 60°, 90°, 120°, and 135° (as shown in Figure 1). The acoustic data base was determined at a simulated flight velocity of 100 ft/s (68.2 mph) and an rpm of 10,500, limits set by the electric motors.
Two different SPLs were recorded at each microphone location for each propeller:
- The level of the fundamental tone at the blade-passing frequency (BPF).
- The overall sound pressure level (OASPL) between 100 Hz and 2,000 Hz.
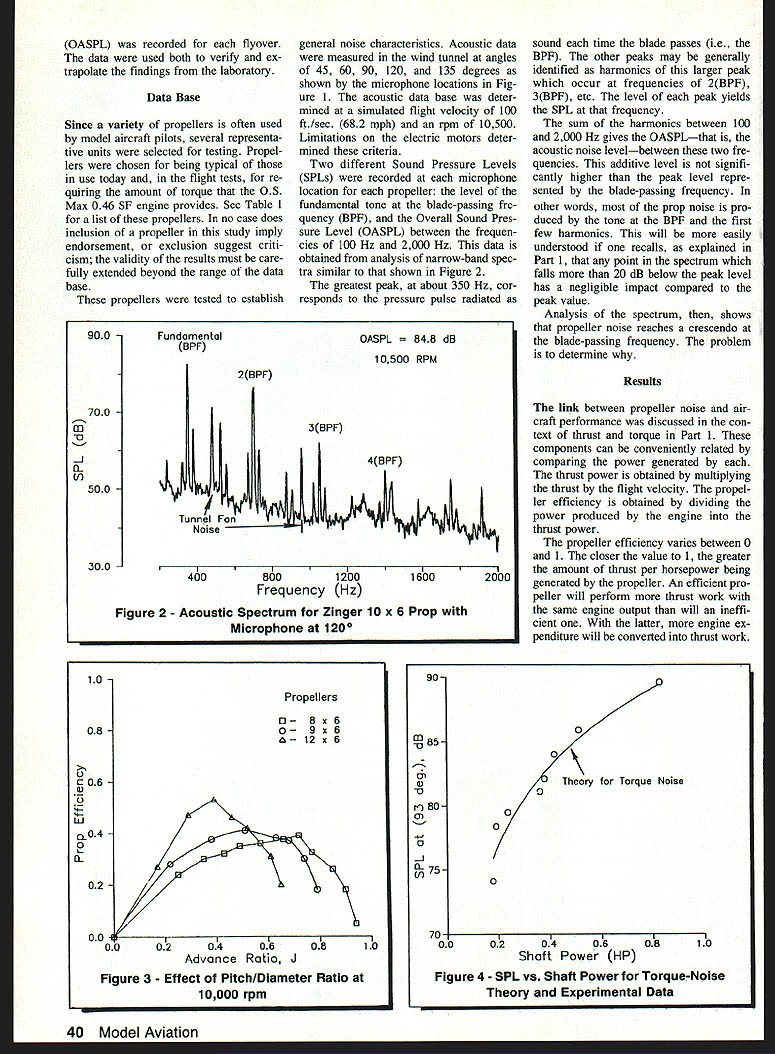
This data was obtained from analysis of narrow-band spectra. The greatest peak, at about 350 Hz in a representative spectrum, corresponds to the pressure pulse radiated as sound each time a blade passes—the BPF. Other peaks are harmonics at 2·BPF, 3·BPF, etc. The level of each peak yields the SPL at that frequency.
The sum of the harmonics between 100 and 2,000 Hz gives the OASPL between these frequencies. This additive level is not significantly higher than the peak level at the blade-passing frequency; in other words, most of the prop noise is produced by the tone at the BPF and the first few harmonics. Any spectral point more than 20 dB below the peak has a negligible impact compared to the peak value.
Analysis of the spectrum shows that propeller noise reaches a crescendo at the blade-passing frequency. The problem is to determine why.
Results
The link between propeller noise and aircraft performance was discussed in the context of thrust and torque in Part 1. These components can be related by comparing the power generated by each. Thrust power is obtained by multiplying thrust by the flight velocity. Propeller efficiency is obtained by dividing thrust power by the power produced by the engine.
Propeller efficiency varies between 0 and 1. The closer the value to 1, the greater the amount of thrust per horsepower produced by the propeller. An efficient propeller will perform more thrust work with the same engine output than an inefficient one.
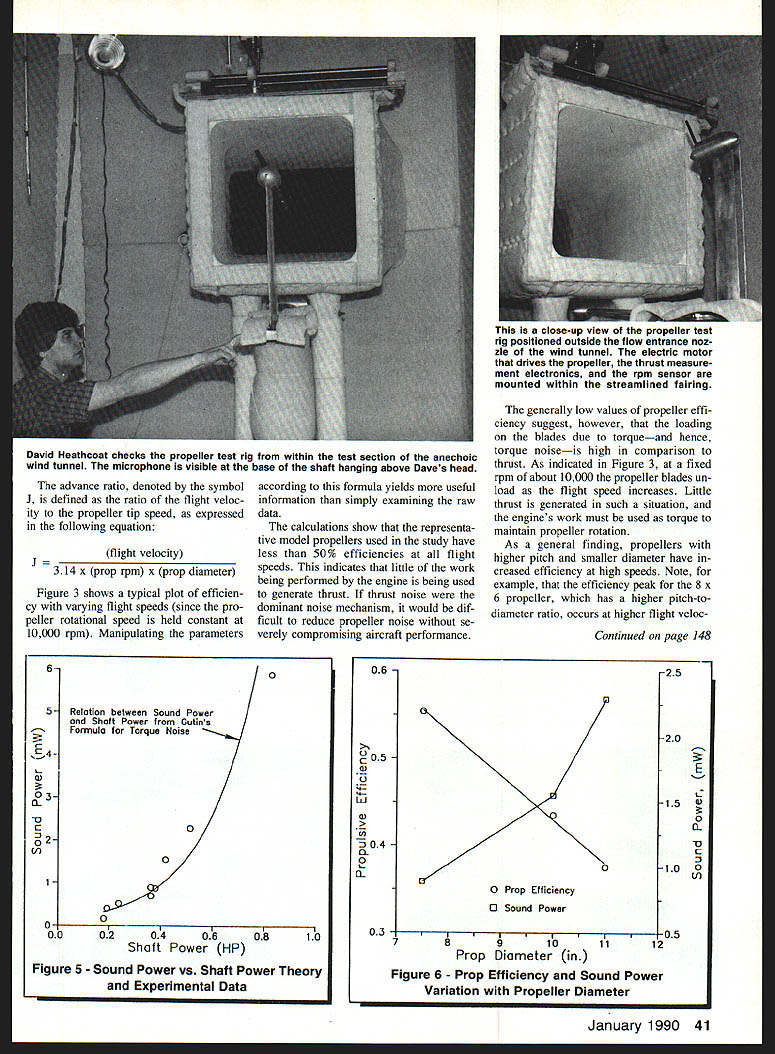
The advance ratio J is defined as the ratio of flight velocity to propeller tip speed: J = (flight velocity) / [3.14 × (prop rpm) × (prop diameter)]
Figure 3 shows a typical plot of efficiency with varying flight speeds (prop rotational speed held constant at 10,000 rpm). Manipulating parameters via the advance ratio yields more useful information than simply examining raw data.
Calculations show that the representative model propellers used in the study have less than 50% efficiency at all flight speeds. This indicates that little of the engine's work is being used to generate thrust. If thrust noise were the dominant mechanism, it would be difficult to reduce propeller noise without severely compromising aircraft performance.
The generally low values of propeller efficiency suggest that blade loading due to torque—and hence torque noise—is high relative to thrust. As shown in Figure 3, at a fixed rpm of about 10,000 the propeller blades unload as flight speed increases: little thrust is generated and the engine's work is used mainly to overcome torque and maintain propeller rotation.
As a general finding, propellers with higher pitch and smaller diameter have increased efficiency at high speeds. For example, the efficiency peak for an 8×6 propeller (higher pitch-to-diameter ratio) occurs at a higher flight velocity. The 12×6 propeller has a higher peak efficiency occurring at lower flight speeds, making it efficient near takeoff but poorer at high speeds. Assuming torque loading is the major cause of propeller noise, propellers that are more efficient at high speeds will provide reduced noise levels without compromising performance.
Figure 5 - Sound Power vs. Shaft Power (Theory and Experimental Data)
Figure 6 - Prop Efficiency and Sound Power Variation with Propeller Diameter
Torque noise
Several findings implicate torque loading as the dominant component of propeller noise. Figure 4 shows a plot of the SPL at the BPF measured in the lab at about 90° for a constant rotational speed. Also shown is a curve generated from accepted empirical theory for torque noise, which correlates closely with experimental data. Since the behavior of the SPL with shaft power follows the expected behavior for torque noise, it is reasonable to conclude that the measured noise source is primarily torque noise.
A broader view is obtained by examining the total acoustic power (sound power) radiated, derived from integrating acoustic pressure over space. Sound power can be compared to a classical relation between sound power and shaft power developed by Gutin. Figure 5 shows this comparison for 10,500 rpm and a simulated flight speed of 100 ft/s. Agreement between the acoustic power data and Gutin’s theory is close, as is the correlation with the results shown in Figure 4. Given the complications in combining sufficient measurements and integrating the data, consistency between the two data sets is notable. Both point to torque-related noise as the leading element in propeller sound.
When propeller efficiency is low, the engine's work is used mainly to overcome torque rather than to produce thrust. If we plot propulsive efficiency against sound power for several props (assuming acoustic power is derived primarily from torque loads), sound power increases as propeller efficiency declines. To reduce variability from thrust-related noise, such plots are more meaningful if thrust is held constant.
As shown in Figure 6, with thrust held constant, acoustic output varies with propeller diameter according to propeller efficiency. This corroborates that the dominant noise mechanism is torque loading. If thrust-related noise were dominant, sound power in Figure 6 would be more nearly constant. Constant thrust does not lead to constant noise; measured noise varies with torque loads.
This is encouraging for modelers: if torque loading is the main noise mechanism, using more efficient propellers will lead to better performance with less noise.
The next article in this series will continue the discussion of thrust and thickness noise. It will demonstrate that, strictly at high tip speeds, thickness noise makes a small contribution to total propeller sound output. Finally, the flight test data will be shown to strongly support the inferences drawn from the laboratory work.
Transcribed from original scans by AI. Minor OCR errors may remain.

