
Model Propeller Noise
By R. Vess, D. Heathcoat, and R. Nagel
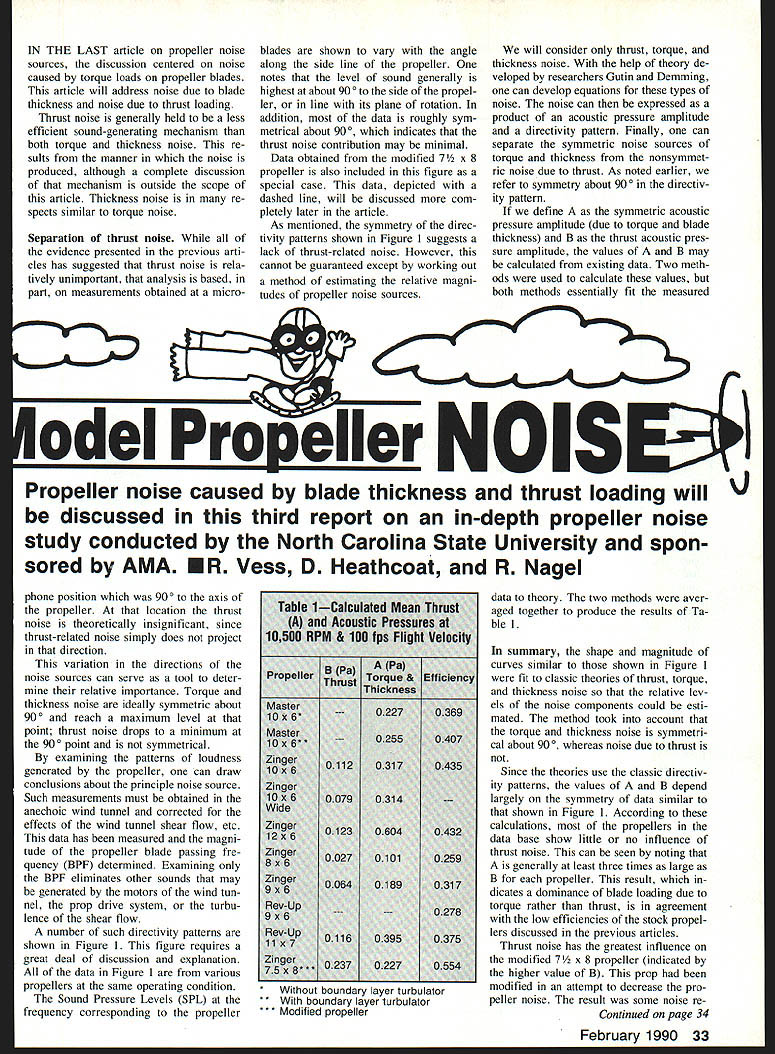
Propeller noise caused by blade thickness and thrust loading is discussed in this third report on an in-depth propeller noise study conducted by North Carolina State University and sponsored by AMA.
In the last article on propeller noise sources, the discussion centered on noise caused by torque loads on propeller blades. This article addresses noise due to blade thickness and noise due to thrust loading.
Thrust noise is generally considered a less efficient sound-generating mechanism than both torque and thickness noise. This stems from the manner in which the noise is produced; a complete discussion of that mechanism is outside the scope of this article. Thickness noise is, in many respects, similar to torque noise.
Separation of thrust noise
Earlier evidence suggested that thrust noise is relatively unimportant, but that analysis was based in part on measurements obtained at a microphone position 90° to the axis of the propeller. At that location thrust noise is theoretically insignificant, since thrust-related noise does not project strongly in that direction.
The different directions in which the noise sources radiate can be used to determine their relative importance. Torque and thickness noise are ideally symmetric about 90° and reach a maximum level at that point; thrust noise drops to a minimum at 90° and is not symmetric.
By examining the directivity patterns of loudness generated by the propeller, one can draw conclusions about the principal noise source. Such measurements must be obtained in an anechoic wind tunnel and corrected for the effects of wind-tunnel shear flow, etc. This data has been measured and the magnitude of the propeller blade-passing frequency (BPF) determined. Examining only the BPF eliminates other sounds that may be generated by wind-tunnel motors, the prop drive system, or turbulence in the shear flow.
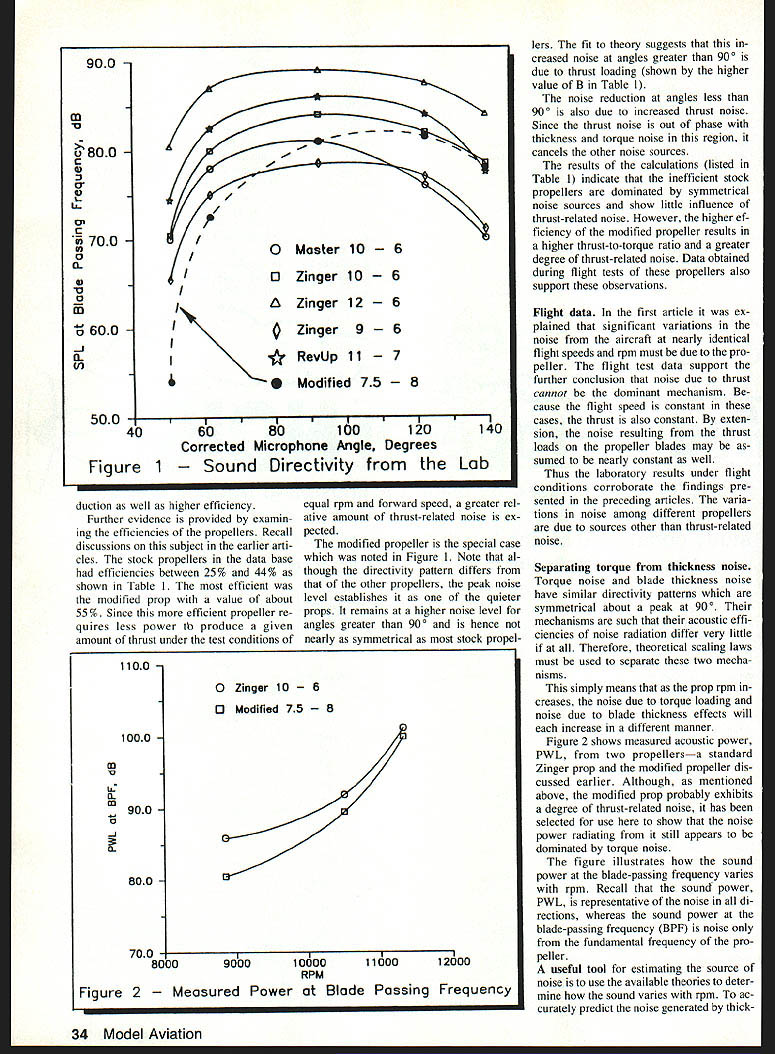
A number of such directivity patterns are shown in Figure 1. All data in Figure 1 are from various propellers at the same operating condition. The sound pressure level (SPL) at the frequency corresponding to the propeller blades is shown to vary with angle along the sideline of the propeller. Levels are generally highest at about 90° to the side of the propeller (in the plane of rotation). Most data are roughly symmetrical about 90°, which indicates that the thrust-noise contribution may be minimal.
Data obtained from a modified 7-1/2 x 8 propeller is also included in Figure 1 as a special case (depicted with a dashed line); it will be discussed later in the article.
Although the symmetry of the directivity patterns in Figure 1 suggests a lack of thrust-related noise, this cannot be guaranteed except by estimating the relative magnitudes of propeller noise sources.
We consider only thrust, torque, and thickness noise. Using theory developed by Gutin and Demming, one can develop equations for these types of noise. The noise can be expressed as the product of an acoustic pressure amplitude and a directivity pattern, which allows separation of the symmetric noise sources (torque and thickness) from the nonsymmetric thrust noise. Symmetry here refers to symmetry about 90° in the directivity pattern.
If A is defined as the symmetric acoustic pressure amplitude (due to torque and blade thickness) and B as the thrust acoustic pressure amplitude, the values of A and B may be calculated from existing data. Two methods were used to calculate these values; both essentially fit the measured data to theory. The two methods were averaged together to produce the results summarized in Table 1.
Table 1 — Calculated Mean Thrust (A) and Acoustic Pressures at 10,500 RPM & 100 fps Flight Velocity
In summary, curves similar to those in Figure 1 were fit to classic theories of thrust, torque, and thickness noise so that the relative levels of the noise components could be estimated. The method took into account that torque and thickness noise are symmetrical about 90°, whereas thrust noise is not.
Because the theories use classic directivity patterns, the values of A and B depend largely on the symmetry of data similar to that shown in Figure 1. According to these calculations, most propellers in the database show little or no influence of thrust noise: A is generally at least three times as large as B for each propeller. This indicates a dominance of blade loading due to torque rather than thrust, consistent with the low efficiencies of stock propellers discussed in previous articles.
Thrust noise has the greatest influence on the modified 7-1/2 x 8 propeller (indicated by the higher value of B). This prop was modified in an attempt to decrease propeller noise. The result was some noise reduction as well as higher efficiency.
Further evidence is provided by examining propeller efficiencies. Stock propellers in the database had efficiencies between about 25% and 44% (see Table 1). The most efficient was the modified prop with a value around 55%. Since the more efficient propeller requires less power to produce a given amount of thrust under the test conditions of equal rpm and forward speed, a greater relative amount of thrust-related noise is expected.
The modified propeller is the special case noted in Figure 1. Although its directivity pattern differs from the others, the peak noise level establishes it as one of the quieter props. It remains at a higher noise level for angles greater than 90° and is nearly as symmetrical as most stock propellers. The fit to theory suggests that the increased noise at angles greater than 90° is due to thrust loading (shown by the higher B value in Table 1).
The noise reduction at angles less than 90° is also due to increased thrust noise. In this region thrust noise is out of phase with thickness and torque noise, so it cancels the other noise sources.
The calculations listed in Table 1 indicate that inefficient stock propellers are dominated by symmetrical noise sources and show little influence of thrust-related noise. However, the higher efficiency of the modified propeller results in a higher thrust-to-torque ratio and a greater degree of thrust-related noise. Flight-test data of these propellers also support these observations.
Flight data
In the first article it was explained that significant variations in noise from an aircraft at nearly identical flight speeds and rpm must be due to the propeller. The flight-test data support the further conclusion that thrust cannot be the dominant mechanism. When flight speed is constant, thrust is essentially constant; therefore, noise resulting from thrust loads on the blades may be assumed nearly constant as well.
Thus, the laboratory results under flight conditions corroborate the earlier findings: variations in noise among different propellers are due to sources other than thrust-related noise.
Separating torque from thickness noise
Torque noise and blade-thickness noise have similar directivity patterns—symmetrical about a peak at 90°. Their mechanisms are such that their acoustic efficiencies differ very little, if at all. Therefore, theoretical scaling laws must be used to separate these two mechanisms.
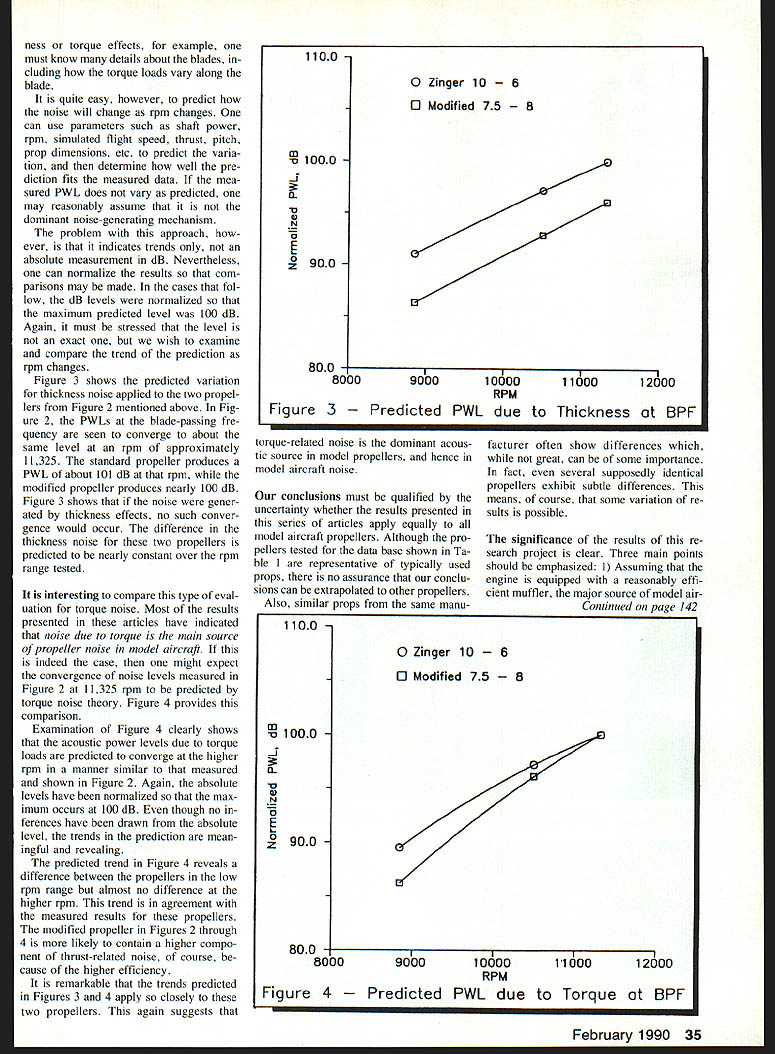
As rpm increases, noise due to torque loading and noise due to blade thickness effects will each change in a different manner. Figure 2 shows measured acoustic power level (PWL) from two propellers—a standard Zinger prop and the modified propeller discussed earlier. Although the modified prop probably exhibits some thrust-related noise, it was selected to show that its radiated noise power still appears dominated by torque noise.
Figure 2 illustrates how the sound power at the blade-passing frequency varies with rpm. Sound power (PWL) is representative of noise radiated in all directions, whereas the sound at the blade-passing frequency (BPF) is noise only from the propeller’s fundamental frequency.
A useful tool for estimating the noise source is to use available theories to determine how sound varies with rpm. To predict thickness- or torque-generated noise accurately, many blade details are required, including torque-load distribution along the blade. It is, however, straightforward to predict how noise will change as rpm changes using known quantities such as shaft power, rpm, simulated flight speed, thrust, pitch, and prop dimensions. One can then determine how well the prediction fits measured data. If measured PWL does not vary as predicted, it is reasonable to assume that the predicted mechanism is not dominant.
This approach indicates trends, not absolute dB values. Results can be normalized so comparisons may be made; in the cases that follow the dB levels were normalized so the maximum predicted level is 100 dB. The absolute level is not exact, but the trend of the prediction as rpm changes is what is compared.
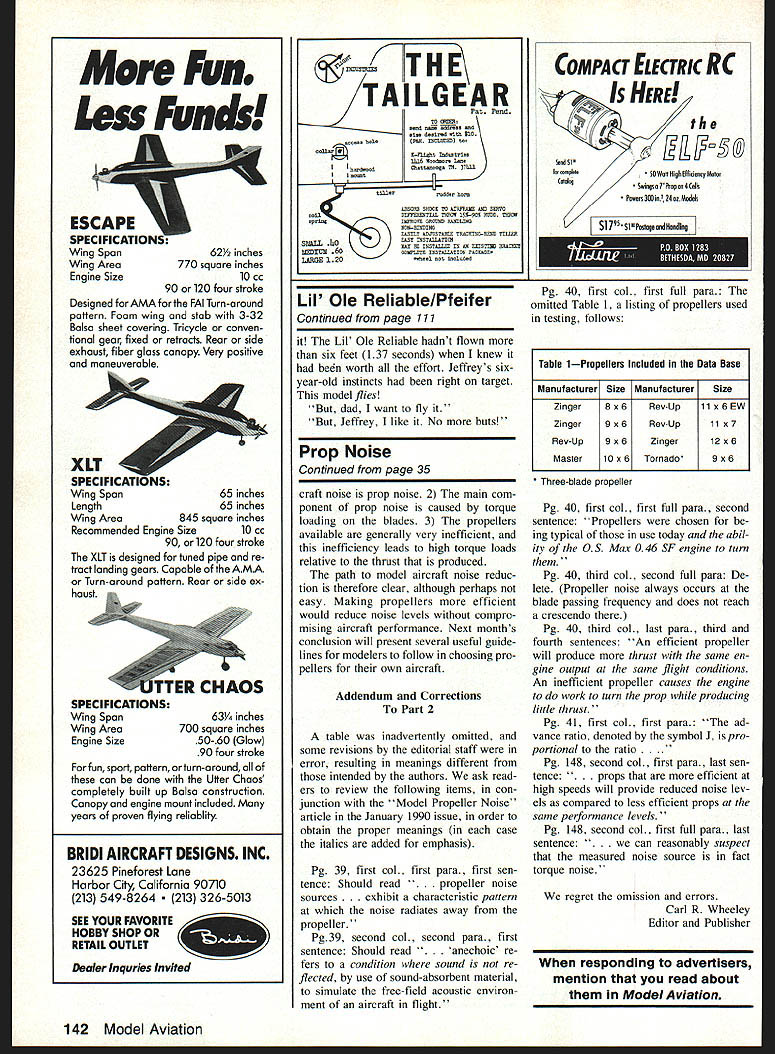
Figure 3 shows the predicted variation for thickness noise applied to the two propellers from Figure 2. In Figure 2 the PWLs at the blade-passing frequency converge to about the same level at approximately 11,325 rpm. The standard prop produces a PWL of about 101 dB at that rpm, while the modified prop produces nearly 100 dB. Figure 3 shows that if the noise were generated by thickness effects, no such convergence would occur: the difference in thickness noise for these two propellers is predicted to be nearly constant over the tested rpm range.
By contrast, torque-noise theory predicts convergence at higher rpm similar to that measured. Figure 4 provides this comparison. Examination of Figure 4 shows that acoustic power levels due to torque loads are predicted to converge at the higher rpm in a way similar to the measured results in Figure 2. Absolute levels have been normalized so the maximum equals 100 dB; the trends are the meaningful result.
The predicted trend in Figure 4 reveals a difference between the propellers at low rpm but almost no difference at higher rpm—matching the measured results. The modified prop in Figures 2–4 is more likely to contain a higher component of thrust-related noise because of its higher efficiency.
It is notable that the trends predicted in Figures 3 and 4 apply closely to these two propellers. This again suggests that torque-related noise is the dominant acoustic source in model propellers, and hence in model aircraft noise.
These conclusions must be qualified by uncertainty whether the results apply equally to all model aircraft propellers. Although the propellers tested for the database shown in Table 1 are representative of commonly used props, there is no assurance the conclusions can be extrapolated to other propellers. Similar props from the same manufacturer often show measurable differences, and even supposedly identical propellers can exhibit subtle variations. Some variation in results is therefore possible.
The significance of this research is clear. Three main points should be emphasized:
- Assuming the engine is equipped with a reasonably efficient muffler, the major source of model-aircraft noise is propeller noise.
- The main component of propeller noise is caused by torque loading on the blades.
- The propellers available are generally very inefficient; this inefficiency leads to high torque loads relative to the thrust produced.
The path to model-aircraft noise reduction is therefore clear, though not necessarily easy. Making propellers more efficient would reduce noise levels without compromising aircraft performance. Next month’s conclusion will present several useful guidelines for modelers to follow when choosing propellers for their aircraft.
Addendum and Corrections To Part 2
A table was inadvertently omitted from Part 2, and some editorial revisions introduced errors that changed the intended meanings. Readers should consult the following corrections in conjunction with the "Model Propeller Noise" article in the January 1990 issue. (Italic emphasis in the original is noted here by surrounding text with quotes.)
- Pg. 39, first column, first paragraph, first sentence:
- Should read: "...propeller noise sources . . . exhibit a characteristic pattern at which the noise radiates away from the propeller."
- Pg. 39, second column, second paragraph, first sentence:
- Should read: "'Anechoic' refers to a condition where sound is not reflected, by use of sound-absorbent material, to simulate the free-field acoustic environment of an aircraft in flight."
- Pg. 40, first column, first full paragraph:
- The omitted Table 1, a listing of propellers used in testing, follows.
Table 1 — Propellers Included in the Data Base
- Zinger — 8 x 6
- Zinger — 9 x 6
- Rev-Up — 9 x 6
- Master — 10 x 6
- Rev-Up — 11 x 6 E/W
- Rev-Up — 11 x 7
- Zinger — 12 x 6
- Tornado* — 9 x 6
*Three-blade propeller
- Pg. 40, first column, first full paragraph, second sentence:
- Should read: "Propellers were chosen for being typical of those in use today and the ability of the O.S. Max 0.46 SF engine to turn them."
- Pg. 40, third column, second full paragraph:
- Delete: "(Propeller noise always occurs at the blade passing frequency and does not reach a crescendo there.)"
- Pg. 40, third column, last paragraph, third and fourth sentences:
- Should read: "An efficient propeller will produce more thrust with the same engine output at the same flight conditions. An inefficient propeller causes the engine to do work to turn the prop while producing little thrust."
- Pg. 41, first column, first paragraph:
- Should read: "The advance ratio, denoted by the symbol J, is proportional to the ratio ..."
- Pg. 148, second column, first paragraph, last sentence:
- Should read: "... props that are more efficient at high speeds will provide reduced noise levels as compared to less efficient props at the same performance levels."
- Pg. 148, second column, first full paragraph, last sentence:
- Should read: "... we can reasonably suspect that the measured noise source is in fact propeller noise."
We regret the omission and errors.
Carl R. Wheeley Editor and Publisher
Transcribed from original scans by AI. Minor OCR errors may remain.

