
RC Sailplane Glide Polar Measurements
The Research and Development Committee of the San Fernando Valley Silent Flyers has been making glide angle measurements of RC sailplanes since December 1977. This testing provides fundamental information about the aerodynamics of models.
Because we are a sailplane club, we test sailplanes. Although RC sailplanes are probably the easiest type of model to measure, other RC airplanes and large free-flight models with mini RC gear installed could also be tested.
A glide polar is a graph which relates the airplane's airspeed to its sink rate. This graph does two things: it defines the straight-line performance of the airplane, and it tells the pilot the optimum speed to fly as a function of air conditions. The polar can be used to calculate lift-to-drag ratios, profile drag coefficient, induced drag coefficients, the spanwise efficiency factor, the maximum coefficient of lift, the coefficient of lift at minimum sink, the coefficient of lift at maximum L/D, etc. From polars of the same plane at different weights, Reynolds number effects can be deduced and quantified. And, information about airspeed alone is useful for other analyses.
A pilot can adjust his plane's speed to achieve maximum actual glide angle in different air conditions if he knows his plane's polar.
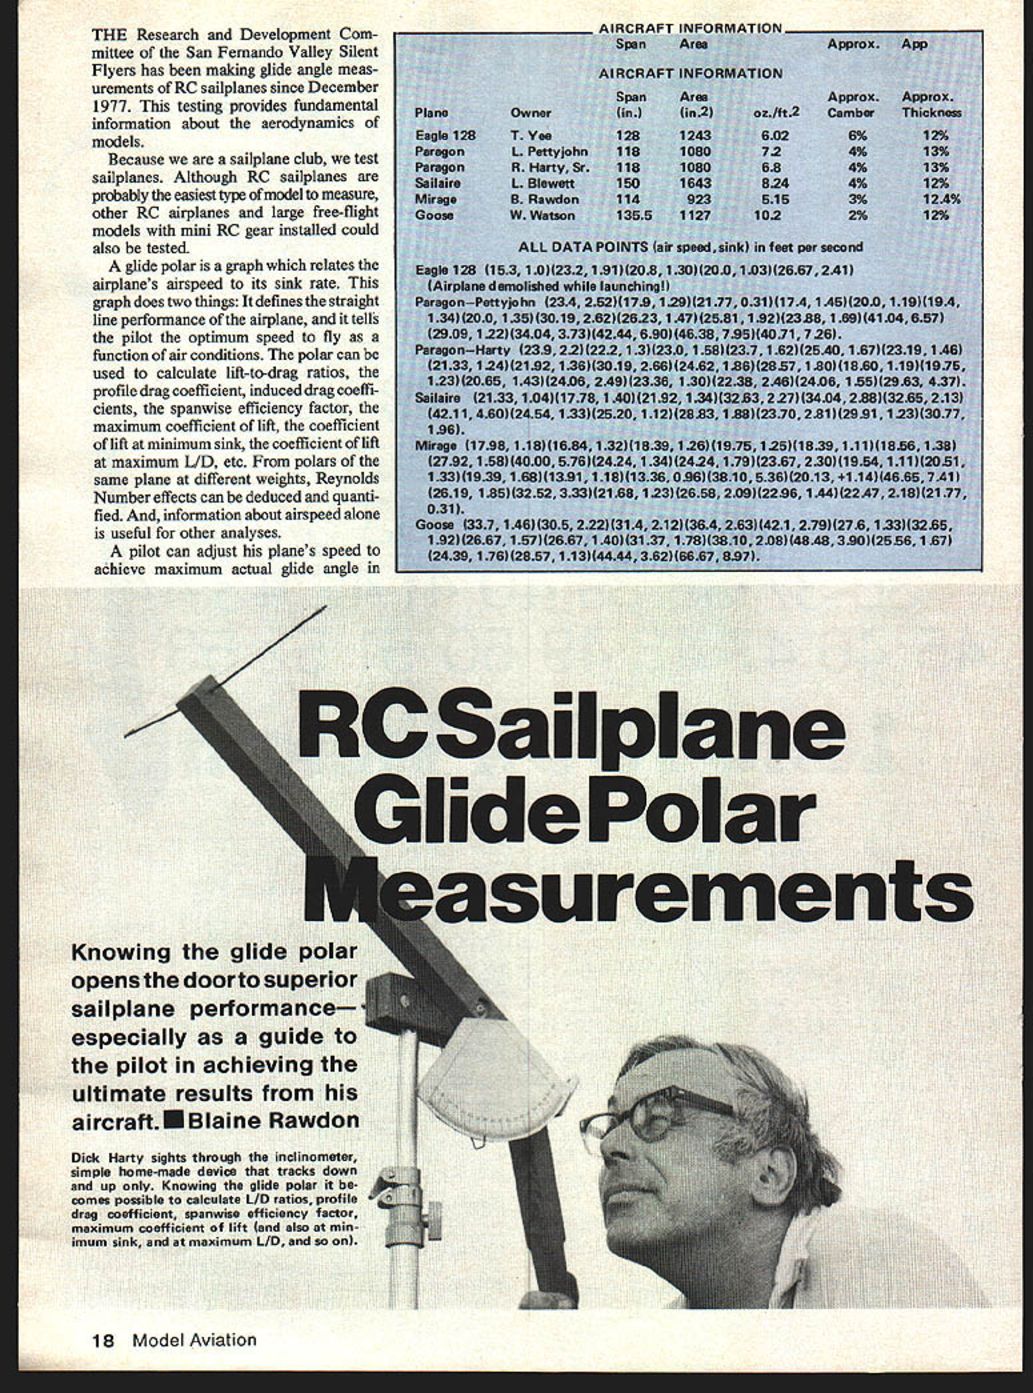
Aircraft Information
- Plane: Eagle 128
Owner: T. Yee Span: 128 in. Area: 1243 in.^2 Approx. oz./ft.^2: 6.02 Approx. Camber: 6% Approx. Thickness: 12%
- Plane: Paragon
Owner: L. Pettyjohn Span: 118 in. Area: 1080 in.^2 Approx. oz./ft.^2: 7.2 Approx. Camber: 4% Approx. Thickness: 13%
- Plane: Paragon
Owner: R. Harty, Sr. Span: 118 in. Area: 1080 in.^2 Approx. oz./ft.^2: 6.8 Approx. Camber: 4% Approx. Thickness: 13%
- Plane: Sailaire
Owner: L. Blewett Span: 150 in. Area: 1643 in.^2 Approx. oz./ft.^2: 8.24 Approx. Camber: 4% Approx. Thickness: 12%
- Plane: Mirage
Owner: B. Rawdon Span: 114 in. Area: 923 in.^2 Approx. oz./ft.^2: 5.15 Approx. Camber: 3% Approx. Thickness: 12.4%
- Plane: Goose
Owner: W. Watson Span: 135.5 in. Area: 1127 in.^2 Approx. oz./ft.^2: 10.2 Approx. Camber: 2% Approx. Thickness: 12%
All data points (airspeed, sink) in feet per second
Eagle 128
(15.3, 1.0) (23.2, 1.91) (20.8, 1.30) (20.0, 1.03) (26.67, 2.41) (Airplane demolished while launching!)
Paragon — Pettyjohn
(23.4, 2.52) (17.9, 1.29) (21.77, 0.31) (17.4, 1.45) (20.0, 1.19) (19.4, 1.34) (20.0, 1.35) (30.19, 2.62) (26.23, 1.47) (25.81, 1.92) (23.88, 1.69) (21.40, 4.65)
Paragon — Harty
(23.9, 2.22) (22.3, 1.33) (20.3, 1.58) (23.7, 1.62) (25.40, 1.67) (23.19, 1.46) (21.33, 1.24) (21.92, 1.36) (30.19, 2.06) (24.62, 1.86) (25.87, 1.80) (18.60, 1.19) (19.75, 1.23) (21.63, 1.34) (24.06, 2.49) (23.36, 1.30) (22.38, 2.46) (24.06, 1.55) (20.63, 4.37)
Sailaire
(21.33, 1.04) (17.78, 1.40) (21.29, 1.32) (21.34, 2.63) (2.27, 3.44) (24.88, 3.65) (2.13, 4.21) (4.60, 4.24) (13.33, 25.20) (1.12, 18.23) (1.88, 23.70) (2.81, 29.91) (1.23, 30.77)
Mirage
(17.98, 1.18) (16.84, 1.32) (18.39, 1.26) (19.75, 1.25) (18.39, 1.11) (18.56, 1.38) (27.92, 1.58) (14.00, 0.57) (6.24, 2.34) (24.24, 1.79) (23.67, 2.30) (19.54, 1.11) (20.51, 1.33) (19.39, 1.68) (13.91, 1.18) (11.36, 0.96) (18.10, 5.36) (20.13, 1.14) (14.46, 6.65) (7.41) (26.19, 1.85) (32.52, 3.33) (21.68, 1.23) (26.58, 2.09) (22.96, 1.44) (22.47, 2.18) (21.77, 0.31)
Goose
(33.7, 1.46) (30.5, 2.22) (31.4, 2.12) (36.4, 2.63) (42.1, 2.79) (27.6, 1.33) (32.65, 1.92) (26.67, 1.57) (26.67, 1.40) (31.37, 1.78) (18.10, 2.08) (48.48, 3.90) (25.56, 1.67) (24.39, 1.76) (28.57, 1.13) (44.44, 4.62) (66.67, 8.97)
Measurement Procedure
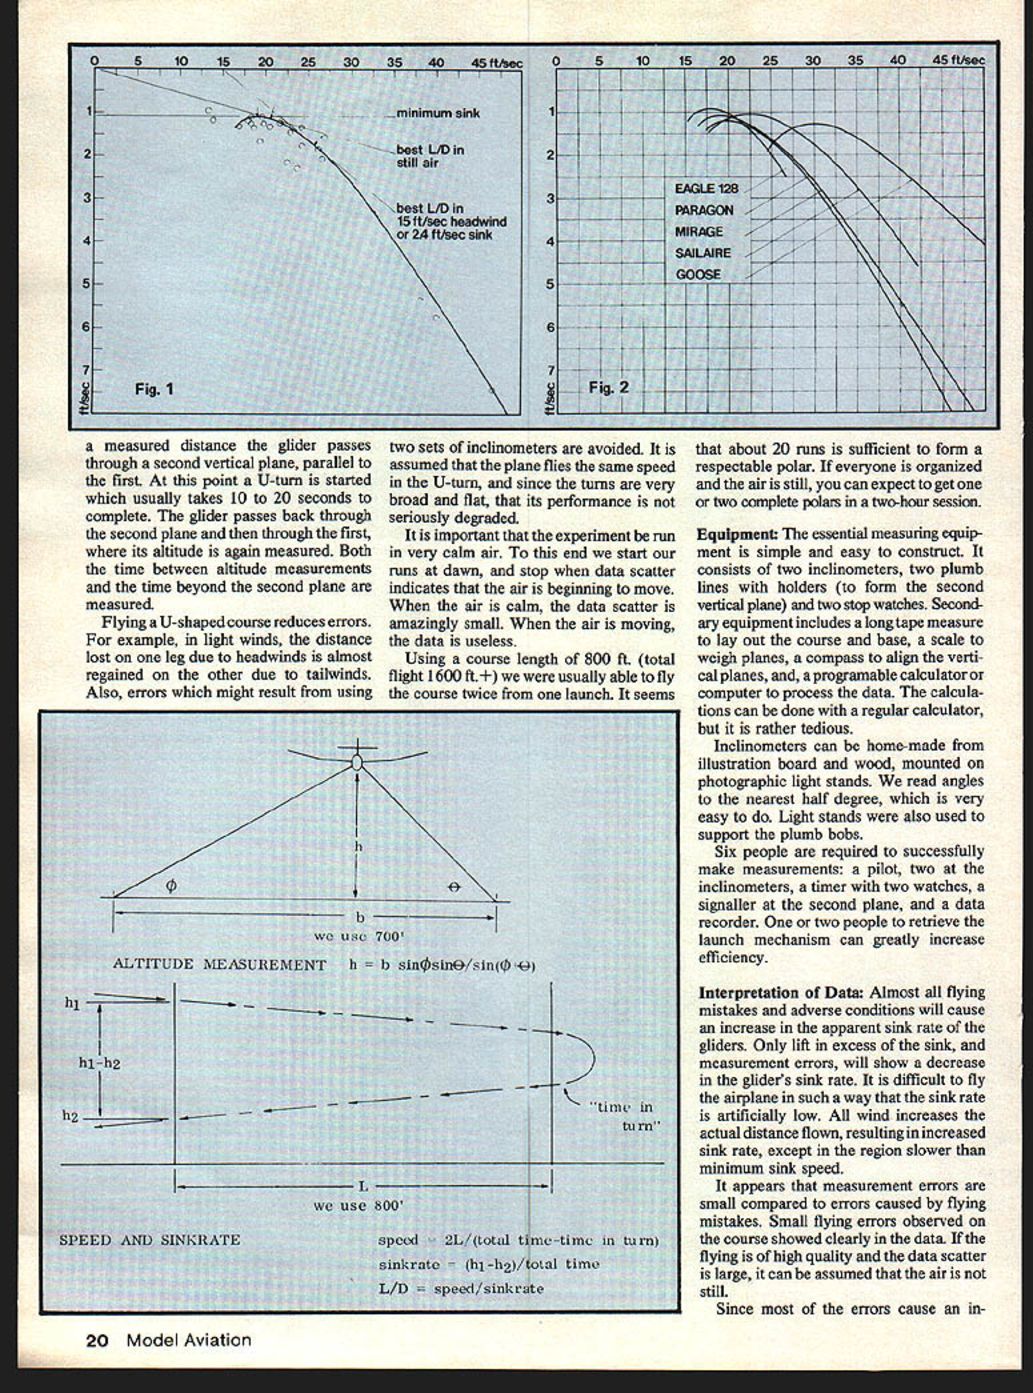
The polar is an idealized graph formed by many data points relating sink rate to airspeed. Each data point is the result of one flight, at constant speed, through a measured course. The time on course and the altitude lost on course are measured.
The altitude is measured as the glider passes through an imaginary vertical plane. Two inclinometers, a measured distance apart, record the angles the glider forms with the horizon, and the altitude is calculated by means of a trigonometric formula. At the end of the course, the altitude is measured again. The difference between the two altitudes is, of course, the altitude lost.
Airspeed is the length of the course divided by the time on the course. Sink rate is the altitude lost divided by the time between altitude measurements.
We do not fly a straight line, but rather a U-shaped course. The glider first passes through the vertical measurement plane. At this point a U-turn is started which usually takes 10 to 20 seconds to complete. The glider passes back through the second plane and then through the first, where its altitude is again measured. Both the time between altitude measurements and the time beyond the second plane are measured.
Flying a U-shaped course reduces errors. For example, in light winds, the distance lost on one leg due to headwinds is almost regained on the other due to tailwinds. Also, errors which might result from using two sets of inclinometers are avoided. It is assumed that the plane flies the same speed in the U-turn, and since the turns are very broad and flat, that its performance is not seriously degraded.
It is important that the experiment be run in very calm air. To this end we start our runs at dawn and stop when data scatter indicates that the air is beginning to move. When the air is calm, the data scatter is amazingly small. When the air is moving, the data is useless.
Using a course length of 800 ft. (total flight 1,600+ ft.) we were usually able to fly the course twice from one launch. It seems that about 20 runs is sufficient to form a respectable polar. If everyone is organized and the air is still, you can expect to get one or two complete polars in a two-hour session.
Equipment
The essential measuring equipment is simple and easy to construct. It consists of two inclinometers, two plumb lines with holders (to form the second vertical plane), and two stopwatches. Secondary equipment includes a long tape measure to lay out the course and base, a scale to weigh planes, a compass to align the vertical planes, and a programmable calculator or computer to process the data. The calculations can be done with a regular calculator, but it is rather tedious.
Inclinometers can be home-made from illustration board and wood, mounted on photographic light stands. We read angles to the nearest half degree, which is very easy to do. Light stands were also used to support the plumb bobs.
Six people are required to successfully make measurements:
- a pilot
- two at the inclinometers
- a timer with two watches
- a signaller at the second plane
- a data recorder
One or two people to retrieve the launch mechanism can greatly increase efficiency.
Interpretation of Data
Almost all flying mistakes and adverse conditions will cause an increase in the apparent sink rate of the gliders. Only lift in excess of the sink, and measurement errors, will show a decrease in the glider's sink rate. It is difficult to fly the airplane in such a way that the sink rate is artificially low. All wind increases the actual distance flown, resulting in increased sink rate, except in the region slower than minimum sink speed.
It appears that measurement errors are small compared to errors caused by flying mistakes. Small flying errors observed on the course showed clearly in the data. If the flying is of high quality and the data scatter is large, it can be assumed that the air is not still.
Since most of the errors cause an increase in the sink rate, there is a tendency for the data points to fill the envelope below the true polar, with a few points poking out because of slight measurement errors or lift on the course. The polar line is generally drawn through, and, in some areas, above most of the uppermost points.
Our data shows significant scatter so drawing the polar line through the points requires subjective judgment. If you have doubts about the polars drawn, plot the points given and draw your own. The difference might exceed 10%, but I would expect it to be closer to 5%. In the case of the Eagle 128, the polar of which is formed by just five points, the variation will be much larger. In any case, don't expect pinpoint accuracy in any polar, and don't make judgments based on small differences.
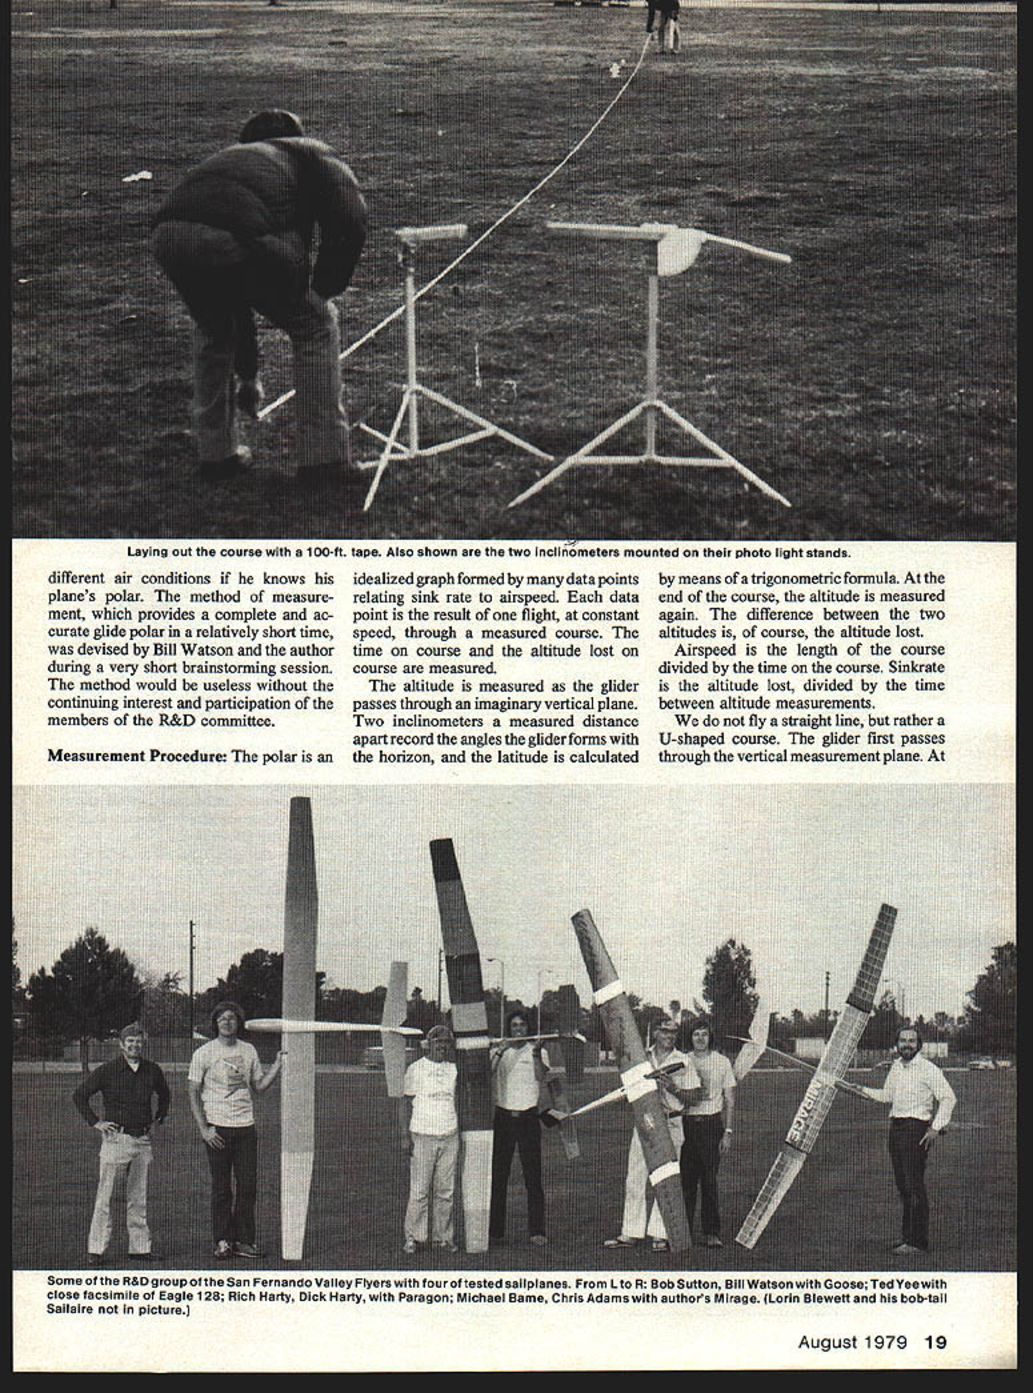
The Sailplanes
All of the gliders were of the rudder-and-elevator, polyhedral variety. The wing sections used are all very simple, with 30% high points and no inflection points in the surfaces, with the exception of the Goose which has a very slight reflex in the upper surface at the trailing edge. The Sailaire and the Paragon have flat-bottom sections with no Phillips entry. The Eagle, Paragon, and Mirage have the forward 30% of the wing formed by stringers or "turbulators" rather than smooth sheeting. The Goose and Sailaire are sheeted to the high point, except that the Sailaire's tip panels (about one-half of the wing) use stringers like the others.
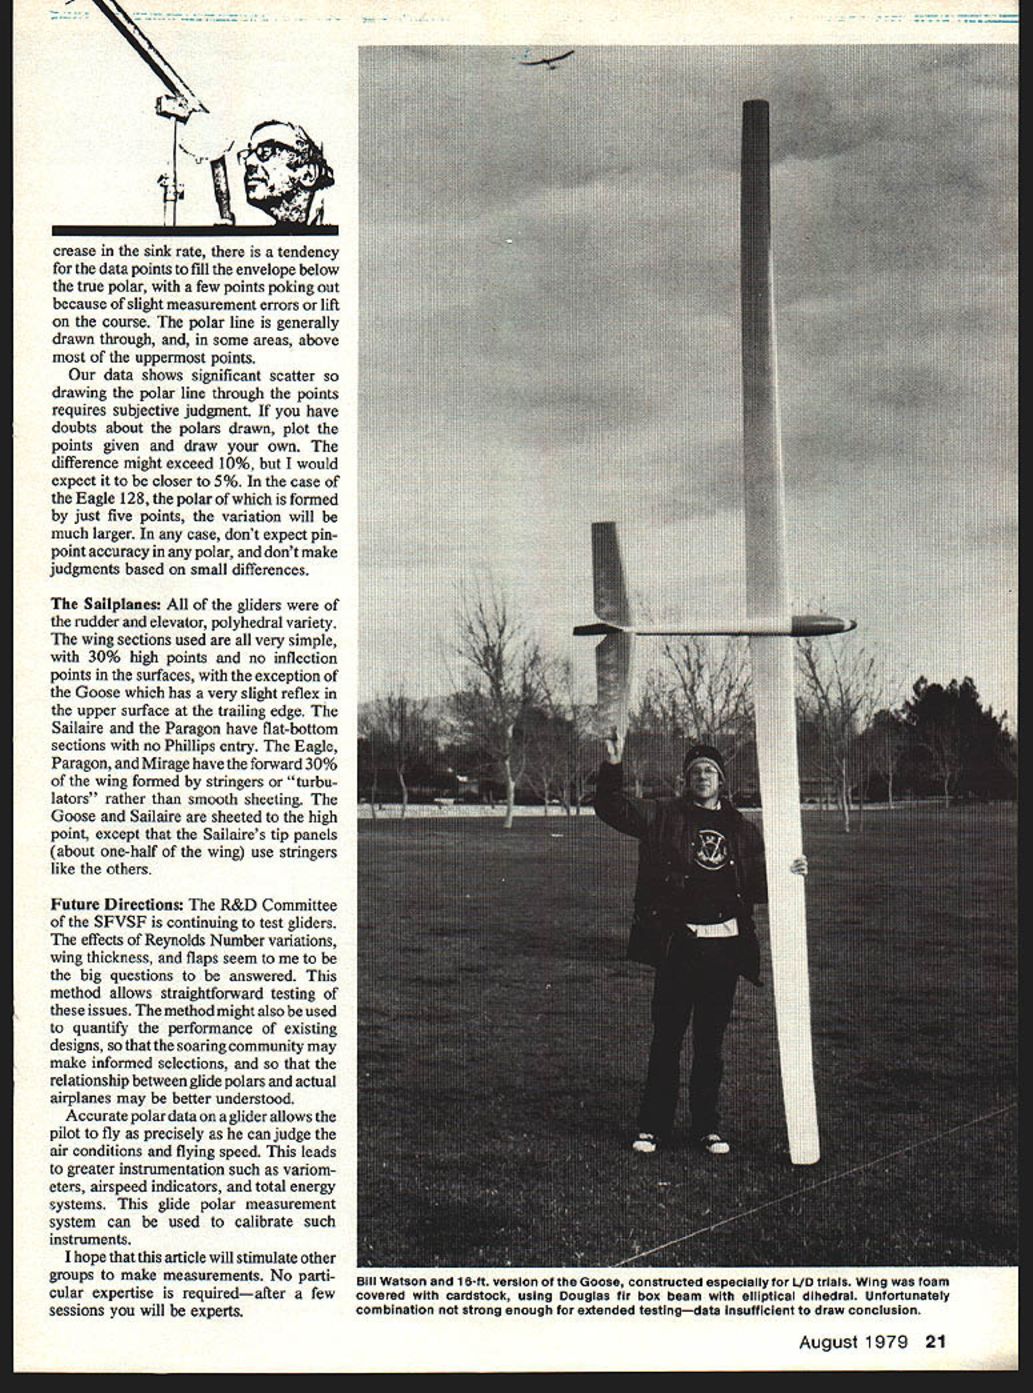
Future Directions
The R&D Committee of the SFVSF is continuing to test gliders. The effects of Reynolds number variations, wing thickness, and flaps seem to be the big questions to be answered. This method allows straightforward testing of these issues. The method might also be used to quantify the performance of existing designs, so that the soaring community may make informed selections, and so that the relationship between glide polars and actual airplanes may be better understood.
Accurate polar data on a glider allows the pilot to fly as precisely as he can judge the air conditions and flying speed. This leads to greater instrumentation such as variometers, airspeed indicators, and total energy systems. This glide polar measurement system can be used to calibrate such instruments.
I hope that this article will stimulate other groups to make measurements. No particular expertise is required—after a few sessions you will be experts.
Transcribed from original scans by AI. Minor OCR errors may remain.

