
Weather and Thermals for Modelers
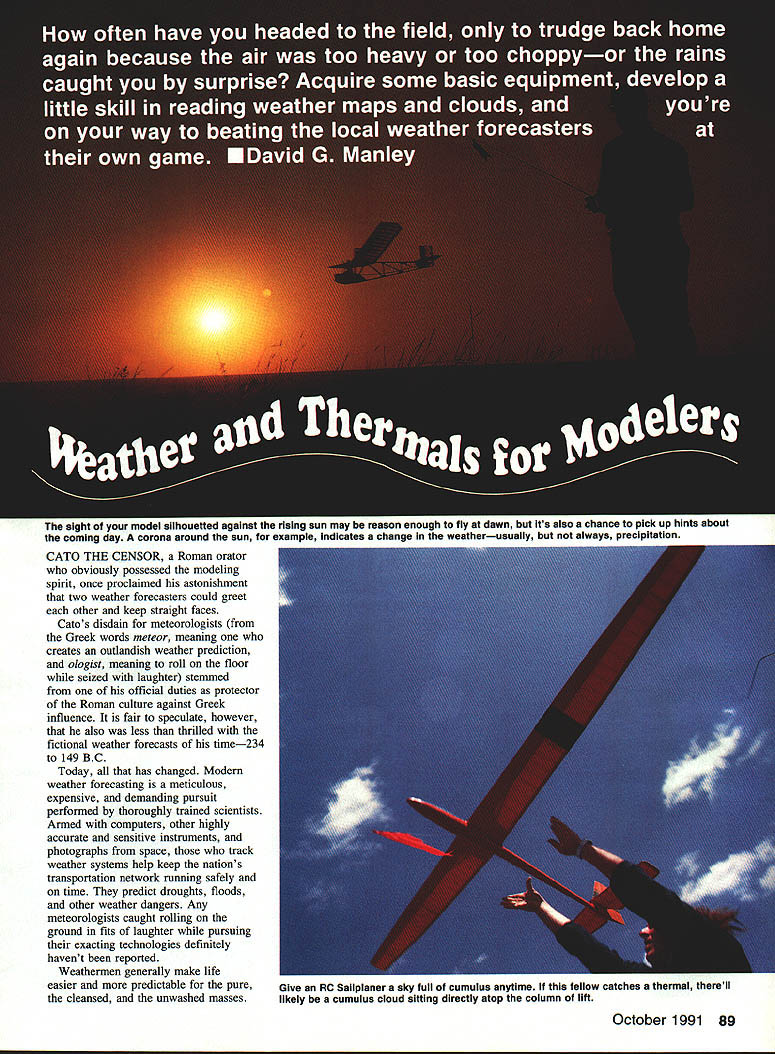
How often have you headed to the field, only to trudge back home again because the air was too heavy or too choppy—or the rains caught you by surprise? Acquire some basic equipment, develop a little skill in reading weather maps and clouds, and you're on your way to beating the local weather forecasters at their own game. — David G. Manley
Cato the Censor, a Roman orator who obviously possessed the modeling spirit, once proclaimed his astonishment that two weather forecasters could greet each other and keep straight faces. Cato's disdain for meteorologists (a joking etymology: meteor—one who creates an outlandish weather prediction; ologist—one who rolls on the floor with laughter) stemmed in part from his duties protecting Roman culture against Greek influence. He also likely was less than thrilled with the fictional weather forecasts of his time (234–149 B.C.).
Today, all that has changed. Modern weather forecasting is a meticulous, expensive, and demanding pursuit performed by thoroughly trained scientists. Armed with computers, sensitive instruments, and photographs from space, meteorologists help keep transportation networks running safely, and they predict droughts, floods, and other weather dangers. Any meteorologists caught rolling on the ground in fits of laughter while pursuing their exacting work certainly haven't been reported.
Weathermen generally make life easier and more predictable for the unwashed masses.
More about thermals
Alas, elusive thermals—mysterious, invisible, useful, and much in demand. Most modelers fall into at least one of those categories.
"Well, we can . . . and we can't," said Mike Thompson, meteorologist for KCTV-TV, Channel 5 in Kansas City. "We're doing more and more with mesometeorology (the study of weather in intermediate-sized areas), but it's a relatively new field for us. We aren't at the point yet where we can predict the weather in your backyard."
According to Peter Chaston, supervisory meteorologist at the National Weather Service Training Center in Kansas City, Missouri, that is more an effect of budgetary limitations than of lack of capability. Predicting the weather with backyard specificity requires on-site—and expensive—manpower and instruments; the work usually is done by private meteorological services, out of reach for most modelers.
That leaves the do-it-yourselfer approach for most modelers. It's a process of cooperation with broader forecasts rather than of competition. Useful tools include an inexpensive barometer (for measuring air pressure), a thermometer, and something better than a sagging silkspan with which to measure humidity (for example, a hygrometer or sling psychrometer). Weather watching on a daily basis is ideal. To keep track of major weather systems, watch the weather maps published in the local newspaper and those shown on television.
Note the location of high- and low-pressure systems relative to your flying field. For example, Chaston says that thermal seekers whose fields are on the western edge of a high-pressure system are ideally located: the system is departing and the air is becoming less stable and more convective.
Convection is caused by unequal heating of the Earth’s surface. As heated air becomes less dense than cooler air, it expands and rises. The denser, cooler air sinks to the ground and replaces the warmer air. This cycle drives thermals.
After noting the location of pressure masses, check your home or field barometer, thermometer, and the wind direction. Keep track of humidity and, when possible, the dew point. A higher-than-predicted wind speed might indicate that a front is closer than expected or that a pressure system arrived on a different schedule.
Dew point is the temperature at which condensation begins. It is a useful tool for measuring the day's flying potential when the weather is marginal. Specifically, dew point is the temperature to which the air must be cooled at constant pressure and moisture content to reach saturation. When the temperature and dew point meet, or the temperature falls below the dew point, fog can develop. For example, if the temperature is 55°F and the dew point is 50°F, a five-degree drop in temperature will result in saturation—possibly fog or rain.
A bit of folk wisdom can be handy when a weather map is unavailable: face the wind and point to the right to find a low-pressure system. (This is also a useful signaling trick.) A high barometric reading may indicate fair weather, but it won't tell you about prevailing wind conditions. You could be in for strong winds, very stable air with few thermals, or virtually no wind. Similarly, high morning humidity might be followed by a good midday burnoff with lots of lift—or the air might remain heavy all day. No single factor determines the weather.
Clouds and what they indicate
Cloud formations are among the best weather indicators. Meteorologists classify clouds by altitude and by form. High clouds use the prefix cirro-, middle-level clouds use alto-, and low-level clouds take no prefix. Any cloud that produces precipitation is often labeled nimbus. Clouds are also divided into two major types: stratus (layered, flat) and cumulus (puffy, vertical). From a modeler's point of view, well-developed cumulus clouds often indicate good thermals; stratus tends to be unhelpful.
Below is a guide to common cloud types, their typical altitudes, and what they generally mean for flying:
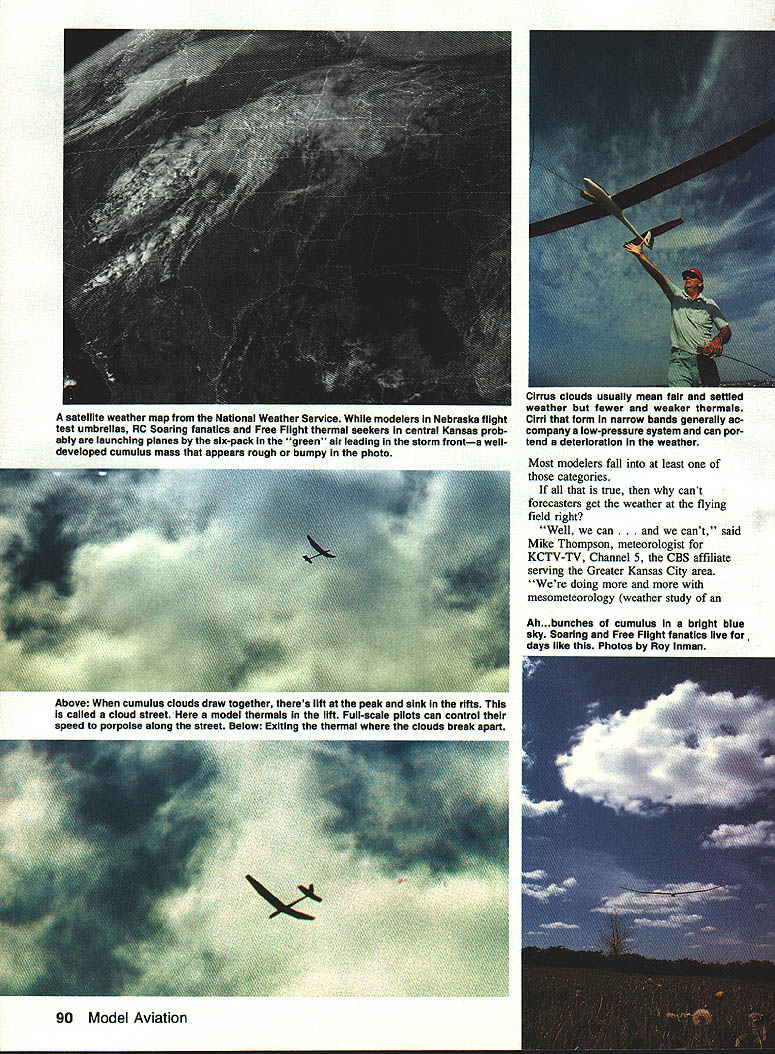
- Cirrus (high, 20,000–40,000 ft): Thin, wispy, fibrous clouds (mare's tails). Formed from ice crystals. Light cirrus alone usually indicates fair weather, but long, narrow bands can signal an approaching low or warm front and reduce surface heating, weakening thermals.
- Cirrostratus (high): A thin, uniform high-layer cloud that can produce halos around the sun or moon. If thickening into altostratus, rain may follow.
- Cirrocumulus (high): Small, white, puffy masses (mackerel sky). Usually fair-weather but can signal changing patterns; may develop vertical motion.
- Altostratus (middle, ~13,000–15,000 ft): Often linear or stripe-like. When preceded by cirrostratus and cirrus, rain is likely (the "watery sky").
- Altocumulus (middle, ~12,000–13,000 ft): Ball-shaped clouds that form in bands or lines; indicate mid-level instability and often precede rain.
- Stratocumulus (low): Layered or patchy, sometimes wavy. Often associated with choppy winds and poor thermal development.
- Nimbostratus (low, 2,000–6,000 ft): Thick, uniform cloud layer evolving from altostratus. Produces steady rain or snow. When it breaks up, scud (small fragments) may trail the rain.
- Stratus (low): Thin stratus resembles fog; thicker forms can produce drizzle. Often hangs near ground level.
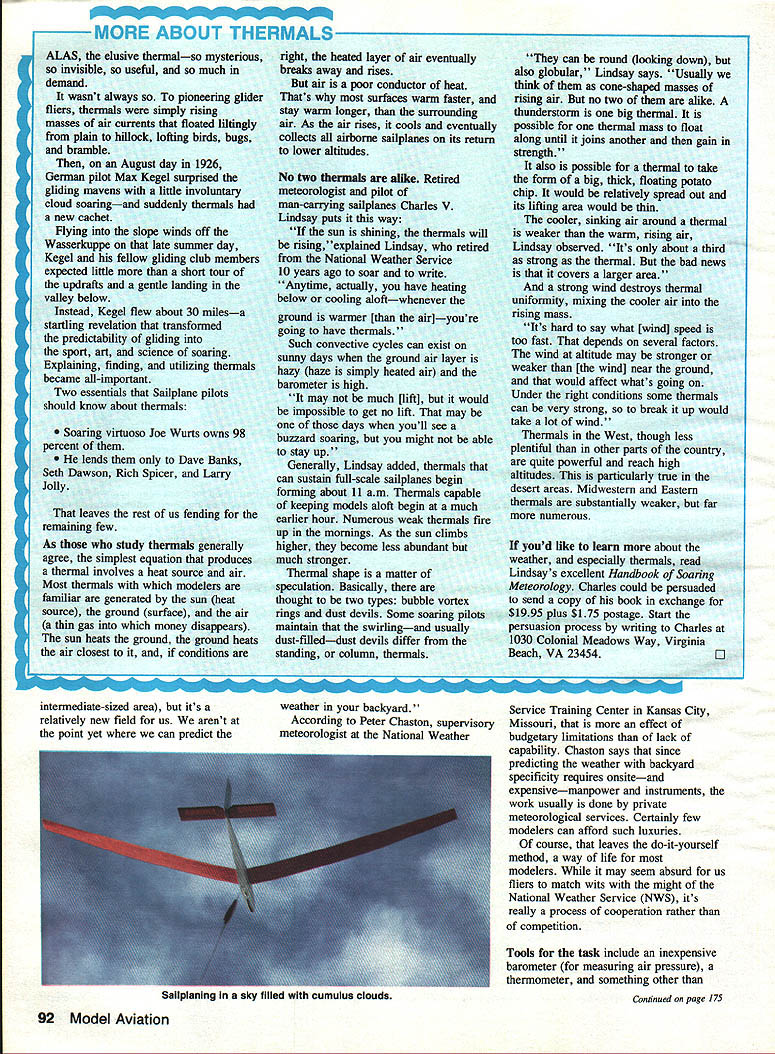
- Cumulus (low to moderate base): Flat bases with cauliflower tops; excellent indicators of thermals. Well-defined, vertically developed cumuli usually mean strong, organized thermals.
- Cumulonimbus (towering): Overgrown cumuli that produce downpours, hail, lightning, thunder, strong winds, and hazardous conditions. Avoid flying near cumulonimbus.
When cumulus clouds show good vertical development, expect strong thermals—so strong that even lightweight debris might be lofted. Conversely, wispy or poorly defined cumuli often indicate choppy, erratic thermals and gusty surface winds.
Practical checklist
- Check all instruments daily. Keep a weather log during the flying season—many National Weather Service forecasts are based on long-term records.
- Watch the sky. Photocopy cloud pictures from books and keep a quick reference so you can track what happens when cirrus gives way to cirrostratus and then to altostratus (rain often follows).
- Watch television weather reports as an adjunct to your own observations. Local weather programs and NWS charts provide useful context.
- Don't bet on the Kansas City Royals to win the 1990 pennant.
As Peter Chaston says, it's a matter of knowing what has happened and what is happening, then learning to anticipate what will happen regularly. "Air can't be created or destroyed," Chaston reminds us. "It has to go somewhere."
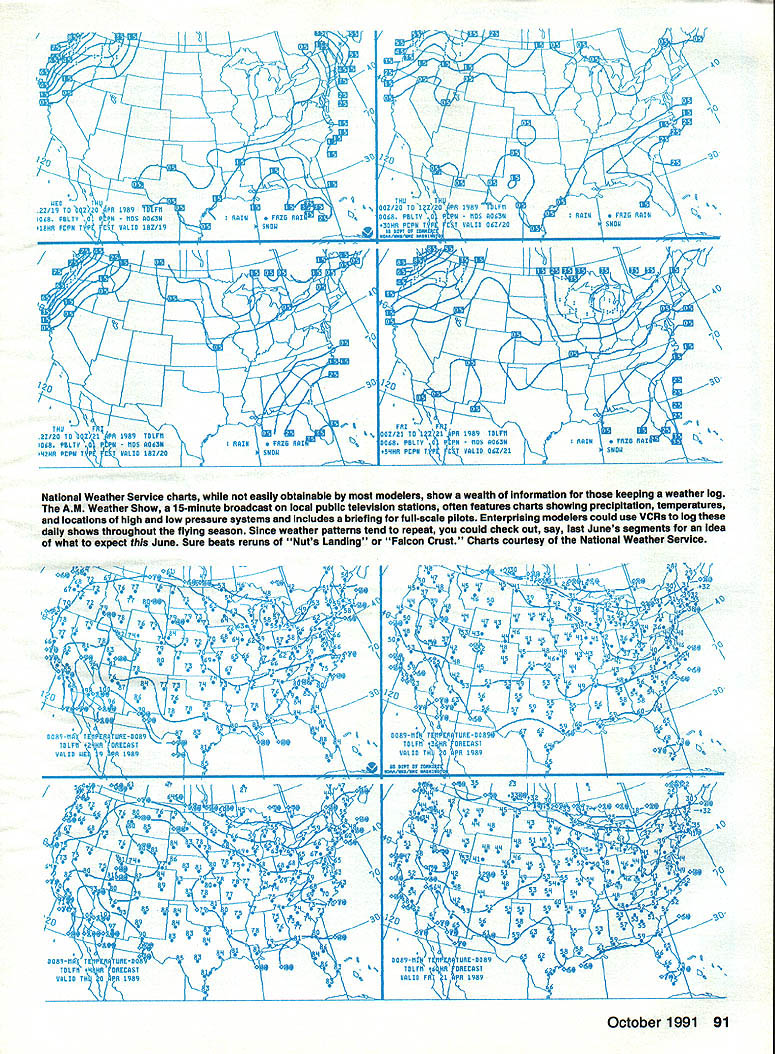
National Weather Service charts show a wealth of information and are easily obtainable. Keeping a weather log and watching televised weather briefings (for example, the 15-minute AM Weather Show on public television) are useful adjuncts to your own weather-predicting efforts. Enterprising modelers could record daily shows throughout the season; since weather patterns tend to repeat, past segments can help predict future conditions.
Transcribed from original scans by AI. Minor OCR errors may remain.

